
When implementing Gantt functionality into an enterprise planning app, developers want to be sure that it will remain responsive at various stages of the workflow, from loading large volumes of project data to processing user actions. Our new benchmark tests cover these and other useful scenarios using scheduling configurations with up to 100,000 tasks, common user operations, and auto-scheduling mode.
The benchmark results provide insights on the performance capabilities of four vanilla JavaScript Gantt components from DHTMLX, Bryntum, Syncfusion, and DevExtreme. With 100,000 tasks and auto-scheduling enabled, DHTMLX Gantt is the only tested component to complete every workload, including loading, task moves, and bulk edits, for both a flat dependency chain and a four-level project tree with dependencies confined to each project.
We are releasing the automated benchmark tool so that anyone can reproduce the same testing scenarios across different working environments and compare the results.
In this blog post, we’ll explore our benchmark methodology and its benefits, highlight what we discovered using this approach, and explain how you can use our benchmark tool for testing JavaScript Gantt components independently.
Key Points about DHTMLX Benchmark Methodology
The benchmark package includes six metrics aimed at capturing Gantt performance at different stages of its operation, from initial data loading and rendering to user interactions with the UI:
- Time to first paint (TTFP) – how quickly the initial Gantt elements start appearing on the screen.
- Time to ready (TTR) – the total elapsed time required for the Gantt chart to process the dataset and become fully operational.
- Memory usage – the amount of JavaScript memory occupied by the loaded Gantt dataset after garbage collection.
- Scrolling FPS – smoothness and responsiveness of the UI when a user navigates through the Gantt chart with scrolling.
- Moving a task – the time required to move a task one month forward and complete all updates related to this action, including recalculating affected dependencies when auto-scheduling is enabled.
- Bulk edit – the time it takes to process a large amount of task changes, including 100 updates, 100 deletions, and 100 insertions.
For a more in-depth examination of how each of these metrics changes as enterprise projects grow in scope and complexity, we used three testing parameters:
1) Datasets of different sizes
Our approach involves not only common datasets for moderate workloads (1,000, 5,000, and 10,000 tasks), but also much larger datasets (50,000, 100,000 tasks), which are not so rare in real enterprise apps. This broad range of dataset sizes helps identify scalability limits, performance degradation, and potential failures.
2) Two dataset structures
JavaScript Gantt components allow using different hierarchy and dependency patterns for organizing project workflows along the timeline. To find out how this factor can affect the Gantt chart performance, we added two types of dataset structures to our tests:
- Flat chain – one hierarchy level of child tasks under a single summary task + one dependency chain linking all child tasks.
- Project tree – four hierarchy levels + dependencies contained within projects, meaning no dependency crosses the project boundary.
3) Auto-scheduling mode
Auto-scheduling is one of the most “expensive” operations for any Gantt engine. It makes a Gantt chart smart and capable of keeping the entire project plan up to date after user edits. However, maintaining this dynamic behavior requires additional calculations, which can affect performance as the number of tasks and dependencies grows, especially in large enterprise applications. To estimate how this extra workload affects the performance of Gantt components, the benchmark includes tests with auto-scheduling both enabled and disabled.
In our benchmark, metrics are tested in 20 configurations: five dataset sizes x two dataset structures x auto-scheduling mode (enabled/disabled). Each test is scheduled for three runs in fresh browser sessions, and the median of the completed measurements is taken for the benchmark.
For this benchmark round, we used synthetic datasets and a MacBook Air M1 with 16 GB of RAM and Chromium 151.0.7922.34 as the reference machine. We also ran the tests on Windows to see how a different environment affects the results. The tables and charts show the MacBook Air M1 measurements.
For this round of tests, we used the following versions of JavaScript Gantt components:
- DHTMLX Gantt 10.0.3
- Bryntum Gantt 7.3.6
- Syncfusion Gantt 34.2.8
- DevExtreme Gantt 26.1.4
To keep the benchmark focused and consistent, we intentionally limited the list of participating products to Gantt components written in pure JavaScript, leaving framework-specific solutions outside the scope of this undertaking.
Now, we can proceed to the most exciting part and share what happened when we pushed the four JavaScript Gantt components beyond the workloads typically seen in performance-related demos.
What Benchmark Results Tell Us
The benchmark results allowed us to take a closer look at various performance aspects of popular JS Gantt components, including loading times, task manipulation speed, browser memory use, and scrolling responsiveness. Using a MacBook Air M1 as the reference machine, we performed a series of tests with datasets from 1,000 to 100,000 tasks, flat and project-tree structures, and auto-scheduling mode.
Here are a few insights on the most noteworthy results:
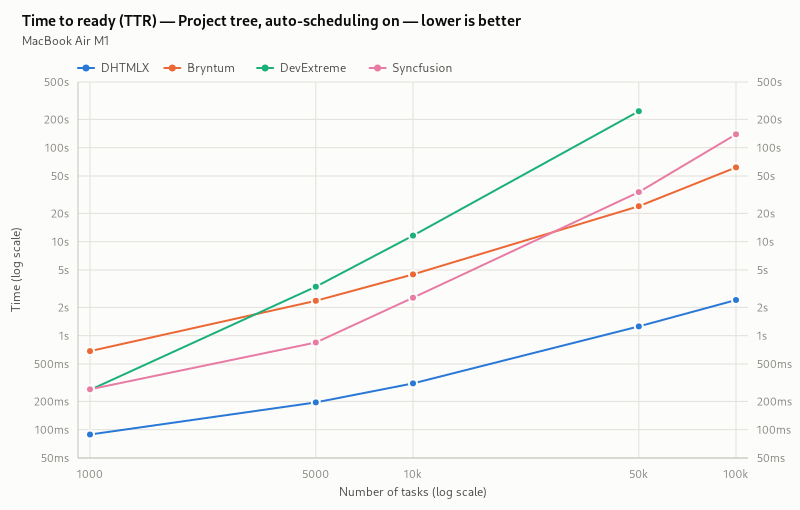
- DHTMLX Gantt demonstrates the fastest loading performance in all time-to-ready test configurations, reaching the readiness state in one of the most demanding scenarios with 100,000 project-tree tasks and auto-scheduling enabled in 2.4 seconds.
- DHTMLX Gantt is the most efficient in processing two types of user edits when the workload increases to 100,000 project-tree tasks and auto-scheduling is enabled, completing a task move in approx. 0.96 seconds and bulk edits in 1.1 seconds.
These findings are a good starting point for a more detailed overview of the benchmark results and what they mean for developers working on a solution with an embedded Gantt view for enterprise-level projects.
Loading Performance: Time to Ready (TTR) and Time to First Paint (TTFP)
As enterprise applications should be designed with loading scalability in mind, developers must be confident that the Gantt component they choose remains usable with growing workloads without turning initial loading into a significant waiting period for users. Our TTR and TTFP tests help clarify these complementary aspects of the Gantt chart loading experience.
TTR results give you a clear idea of how long it takes for the chart to become fully operational, which is essential for end-users who value a fast start without long waits. Differences between components in loading times may have little practical impact with small datasets (e.g., 1k tasks), but become more pronounced at 50,000 –100,000 tasks, where longer waits can seriously affect the user experience in enterprise-level apps.
TTFP is also worth considering because when users start seeing Gantt chart outlines on the screen quickly, it makes an application feel more responsive.
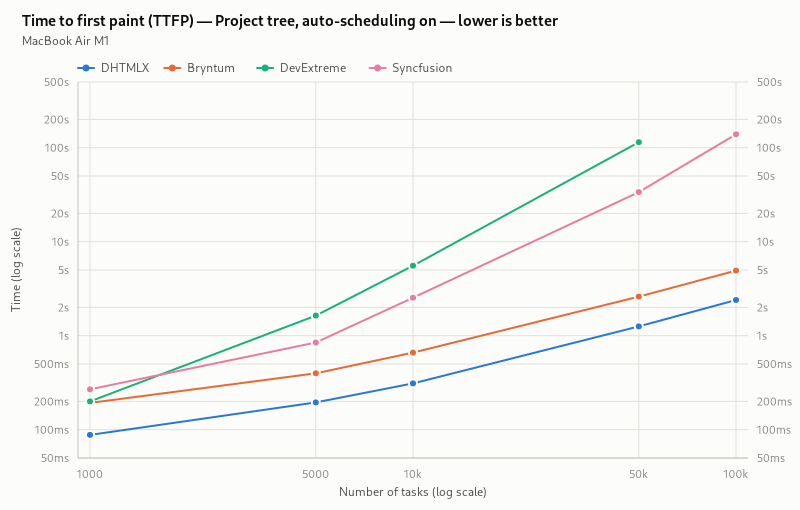
DHTMLX Gantt paints Gantt elements as fast as it prepares the chart for user interactions, meaning there is almost no gap between TTR and TTFP test results. With 100,000 project-tree tasks, DHTMLX Gantt completes both loading tests in 1 second with auto-scheduling off, while enabling auto-scheduling slightly increases the time to 2.4 seconds.
A different loading pattern can be seen, where TTR and TTFP test results differ greatly from one another. Bryntum Gantt, for instance, starts displaying the first rows of a Gantt chart containing 100,000 project-tree tasks in about 5 seconds regardless of the auto-scheduling mode. However, the Gantt chart becomes fully operational only after approximately 53.5 seconds with auto-scheduling disabled and 61.8 seconds with auto-scheduling enabled. In practice, this means that users would have to wait for about a minute before they can interact with the Gantt chart.
Syncfusion and DevExtreme show significant slowdowns in both TTR and TTFP tests as workloads increase. At 100,000 project-tree tasks with auto-scheduling disabled, Syncfusion shows the same result in both TTR and TTFP tests, namely 255 seconds, while DevExtreme does not complete the test due to the timeout.
In general, DHTMLX Gantt provides the best balance between first visual feedback and full working capacity, performing equally fast in both loading measurements even at the largest tested workload of 100,000 tasks.
Task Manipulations: Moving a Task and Bulk Editing
Task manipulations are the most practical tests because they show how Gantt components perform during the interactions they are designed to support, helping users manage projects. In essence, managing a project with a Gantt chart involves regular changes like moving a task or bulk edits to the project schedule and automatic recalculation of affected dependencies. That is why users expect these updates to be processed and reflected in the UI without noticeable delays.
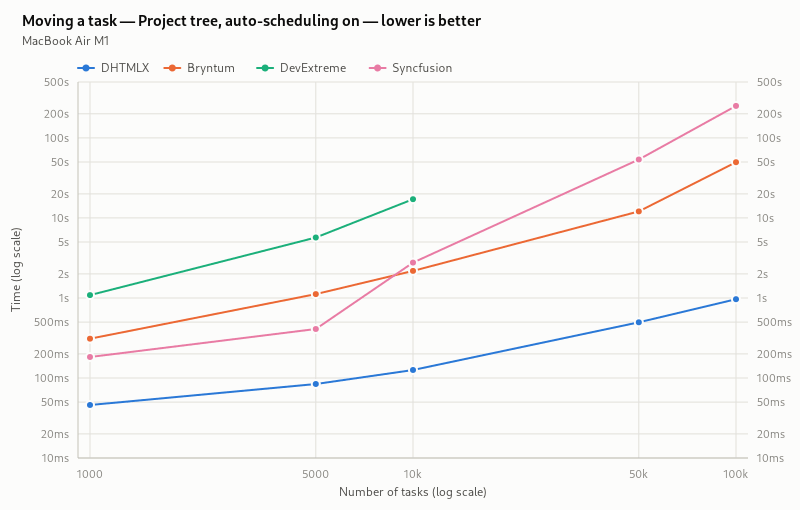
DHTMLX Gantt consistently delivers the strongest results across all task-moving and bulk-edit tests. With auto-scheduling disabled, it completes task moves in under a third of a second and bulk edits in under half a second across both dataset structures and all tested sizes.
With auto-scheduling enabled, at 50,000 project-tree tasks, a task move for DHTMLX Gantt takes approximately 0.5 seconds, compared with 12.1 seconds for Bryntum and 53.8 seconds for Syncfusion. Bulk editing takes 0.53 seconds for DHTMLX Gantt, 13.0 seconds for Bryntum, and 118.1 seconds for Syncfusion.
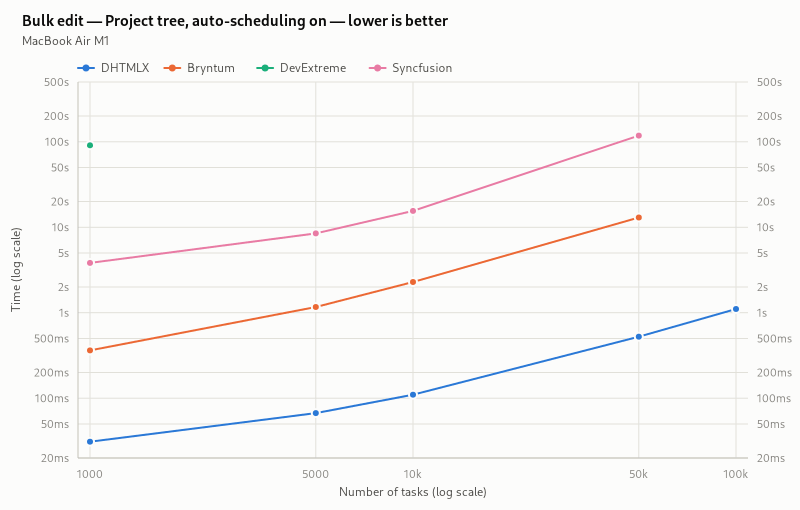
The DHTMLX advantage becomes particularly evident when pushing the workload to 100,000 tasks with auto-scheduling enabled, where even routine schedule changes may trigger complex dependency recalculations across thousands of tasks. DHTMLX Gantt is the only tested component to complete the task-moving scenario on the 100,000-task flat chain and bulk edits on both data structures with auto-scheduling enabled. For bulk editing at 100,000 project-tree tasks with auto-scheduling enabled, Bryntum encountered an error, Syncfusion did not settle within the test limit, and DevExtreme’s test was skipped following earlier failures. Syncfusion completed the test in about 4 minutes 16 seconds in a separate Windows run.
Test results show that DHTMLX Gantt helps ensure fast response times during task management operations and a more predictable user experience, as workflows scale up over time.
Memory Use
Why is it important for developers to know how much browser resources the Gantt chart consumes? In enterprise web apps, a Gantt chart is often a part of a larger system, so its memory footprint affects the resource availability for the rest of the app. Therefore, this metric is another noteworthy point when evaluating whether a specific Gantt component can fit comfortably into a comprehensive enterprise environment.
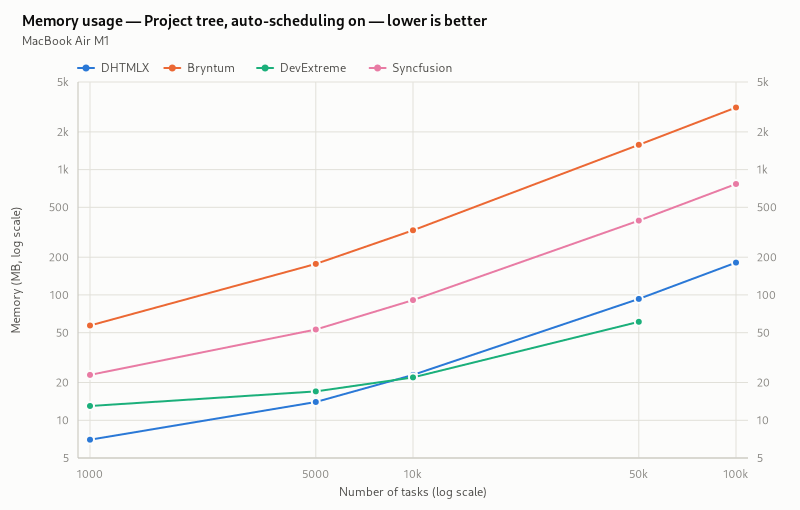
DHTMLX Gantt requires the least JS heap memory across all datasets with no auto-scheduling. For 100,000 project-tree tasks, DHTMLX Gantt uses 63 MB, compared with 755 MB for Syncfusion and approximately 3 GB for Bryntum.
Enabling auto-scheduling mode increases these figures, but DHTMLX Gantt retains the overall advantage. The strong position of DHTMLX Gantt in memory consumption looks especially noticeable at 100,000 tasks, where it uses 181 MB, while Syncfusion and Bryntum need 768 MB and about 3.1 GB, respectively. Interestingly, DevExtreme exceeds the loading time limit at 100,000 tasks, so no memory measurement is recorded, although it uses the least JS heap at 50,000 tasks.
DHTMLX Gantt’s memory headroom leaves more browser resources for other functionalities in enterprise apps, reduces the risk of performance issues from high memory usage, and provides more opportunities to scale the app in the future.
Scrolling FPS
Smooth Gantt chart scrolling is a significant element of UX in enterprise apps, where users need to quickly navigate through large project schedules with thousands of tasks.
In our benchmarks, DHTMLX Gantt maintains scrolling at the ceiling of the reference machine (60 FPS) in all scenarios, including tests with the largest datasets. Bryntum and Syncfusion show comparable efficiency in scrolling tests, while only DevExtreme performs worse as workloads increase. This metric is certainly less illustrative in distinguishing between the tested Gantt components, but the results make it clear that DHTMLX Gantt ensures a smooth scrolling experience through all benchmark tests.
For complete information on Gantt performance test results, read the official benchmarks report.
Benchmark Leaders (Summary)
Here is the summary table that names performance leaders for each of the six benchmark metrics among the four tested Gantt components, with the configuration including the project-tree structure and auto-scheduling enabled at 1k, 10k, and 100k tasks:
| Benchmark metric | 1k tasks | 10k tasks | 100k tasks |
| Time to ready (TTR) | DHTMLX | DHTMLX | DHTMLX |
| Time to first paint (TTFP) | DHTMLX | DHTMLX | DHTMLX |
| Memory use | DHTMLX | DHTMLX/DevExtreme* | DHTMLX |
| Scrolling FPS | DHTMLX/Bryntum/Syncfusion* | DHTMLX/Bryntum/Syncfusion* | DHTMLX/Bryntum/Syncfusion* |
| Moving a task | DHTMLX | DHTMLX | DHTMLX |
| Bulk edit | DHTMLX | DHTMLX | DHTMLX |
*Differences in test results within 25% are considered to be comparable.
The benchmark results show why Gantt performance should be evaluated under workloads that reflect the scale and complexity of real enterprise apps. At smaller workloads, several components may appear sufficiently fast, but the picture usually changes significantly as task counts and scheduling complexity increase over tens of thousands of tasks. This confirms the value of our broad benchmark approach, in which different test conditions help detect performance limitations that often become serious problems for enterprise-level apps.
Overall, the results demonstrate that DHTMLX Gantt can maintain consistent performance when workloads approach the scale of large enterprise projects. It gives developers confidence that Gantt interfaces built with DHTMLX will remain responsive not only when loading projects with up to 100,000 tasks, but also during common interactions with the project schedule.
How to Use the DHTMLX Benchmark Tool to Test Gantt Performance
The new DHTMLX benchmark tool for Gantt charts offers a range of practical benefits:
- Open and reproducible – the benchmark code and test configurations are publicly available so that the results can be independently reproduced.
- Revealing test scenarios – a wide range of test parameters makes it possible to run both typical and stress tests, increasing the chances of identifying potential performance bottlenecks.
- Fully automated process – the tool automatically runs predefined scenarios, collects results, and stores them in a structured format.
- Uniform test scenarios – identical test procedures are applied to each component included in the benchmark.
- Flexible version selection – new versions of the Gantt components can be easily added for testing. Note: updates should not include breaking changes that may affect the products’ initialization.
Here is what you have to do to conduct your own tests using the Gantt performance benchmark tool:
- Clone the benchmark repository
- Run the following commands in the cloned directory:
npm run setup
npm run bench
That’s it. Happy testing!
PS: If you have any remarks or suggestions regarding our approach, feel free to create a new issue in the project’s repository.