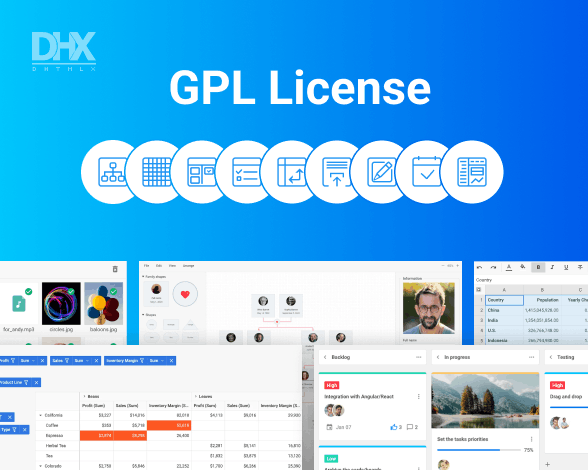
JavaScript Diagram Library
DHTMLX Diagram is a JavaScript diagram library for building interactive org charts, flowcharts, mind maps, UML diagrams, swimlanes, timelines, network diagrams, and PERT charts in web apps.
JS Diagram Examples


Improve User Experience with Our JavaScript Diagrams
Arrange shapes neatly with a single click via 2 smart algorithms.
Add custom sections with any shapes you want, set any size for preview.
Manage sections and settings for live editing.
Select several items, drag, align, distribute, or simply delete them.
Create any new shape and add event handlers for custom shapes.
Select and drag shapes in the grid with greater precision.
Manage toolbar elements to help users to control the editing process.
Turn Natural Language into Structured Diagrams Instantly

DHTMLX Diagram Library Features
Diagram Types You Can Build with DHTMLX

How to Use JavaScript Diagram Editors
Why Choose DHTMLX JavaScript Diagram?
DHTMLX Diagram Licensing and Pricing
|
Individual
Total: $599
|
Commercial
Total: $1299
|
Enterprise
Total: $2899
|
Ultimate
Total: $5799
|
| License Terms | Read License Agreement | Read License Agreement | Read License Agreement | Read License Agreement |
| Developers | 1 | 5 | 20 | |
| Projects | 1 | 1 | 5 | |
| Use in SaaS (unlimited end-users) | ||||
| Source code | ||||
| Perpetual distribution rights |
|
Support Plan
|
Standard | Premium | Premium | Ultimate |
| Time Period | 1 year | 1 year | 1 year | 1 year |
| Updates | Major, minor, and maintenance updates | Major, minor, and maintenance updates | Major, minor, and maintenance updates |
Major, minor, and maintenance updates
Priority queue for bug fixing
|
| Support requests | 10 | 30 | 50 | |
| Response time | 72h | 48h | 48h | 24h |
| Personal Account Manager |
|
Functionality
|
PRO | PRO + 1 add-on | PRO + 1 add-on | PRO + 2 add-ons |
| Online export to PDF/PNG without watermark | Free for 1 year | Free for 1 year | Free for 1 year | Free for 3 years |
| Free local PDF/PNG export module |
Unlock up to 65% Savings with DHTMLX Bundles


Frequently Asked Questions About DHTMLX Diagram
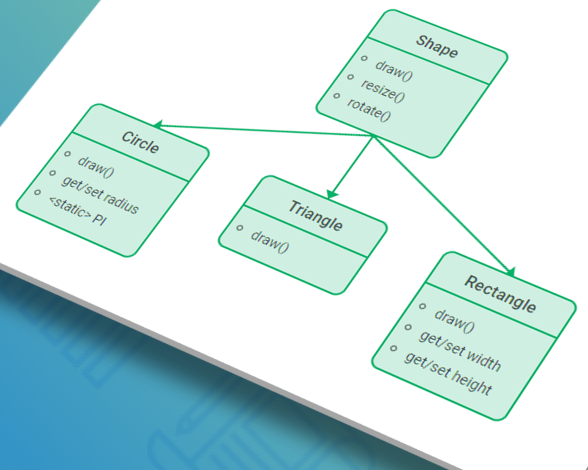
You can create any possible diagram you would like with DHTMLX. We provide a set of ready-made figures for building org charts, flowcharts, mind maps, block diagrams, decision trees, activity diagrams, etc. Besides, you can easily develop network diagrams, UML class diagrams, entity-relationship diagrams, as well as any other type you need with the help of simple HTML templates.
Yes, you can. You can design any imaginable shape you would like. It is possible due to our plain HTML templates, which enable developers to add any figure to the DHTMLX JavaScript diagram library. Thus, you can create network diagrams, sitemaps, Venn diagrams, hospital org charts, and whatnot.
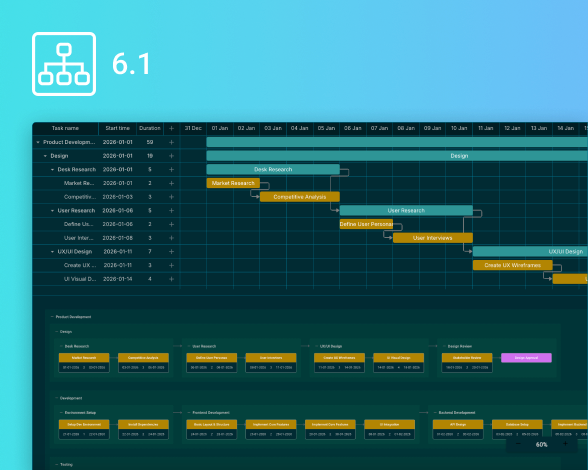
DHTMLX Diagram library provides an auto-layout algorithm, so you don't have to arrange nodes and connectors by hand. You only need to pick the necessary shapes from the left panel and drag-and-drop them to the editing area. Then the algorithm will organize any number of chaotically placed nodes into a hierarchical layout at one click of a button.
Yes, our JS diagram library supports PDF and PNG formats. You can either export a diagram online or with the help of a local export module, which you can install on your PC. Thus, you can easily export your diagram and then print it.
The process of loading data into the editor is simple. The editor as well as our Diagram JS library reads data in the JSON format. You have two options. You can either load data from an external file using the load method or a local data source using the parse method.
Yes, you can change the scale of your HTML5 diagram programmatically. You can also create a convenient UI for zooming in and out in your web application. Moreover, you have an opportunity to specify how elements will look like when a user zooms in and out. It is possible via HTML templates. Thus, you can modify the appearance of your diagram for every zoom level.
Certainly, the DHTMLX Diagram library enables JavaScript developers to add as many org chart cards as they need. There are no limitations on their number. Branches can be collapsed and expanded in one click. Besides, you can add a search field to quickly find the needed part of your chart or a slider for zooming to navigate a large organization chart without effort.
Sure, you can embed a JavaScript diagram editor into your web app and configure it entirely to the needs of your end-users. For instance, you can set up your own sections in the Shapebar and equip them with the required figures. You can also specify the necessary editing and styling options in the Editbar and fine-tune the editor's toolbar.
Latest DHTMLX Diagram News, Releases, and Tutorials

a Question