If you look at how projects were handled five, ten, or twenty years ago, the differences are hard to miss. New trends and technological advances continue to reshape the way project managers work at every level. One of the clearest examples in recent years is the rapid rise of AI technologies, which are already being actively integrated into modern planning and scheduling apps to automate tasks, optimize resources, and improve accuracy.
Yet some tools have proven their effectiveness and relevance in this field for decades. The Gantt chart is one of them. In 2026, project managers will continue to face enduring dilemmas in workflow organization and resource allocation, which can be addressed efficiently with a Gantt chart.
In this blog post, we’ll consider eight popular JavaScript Gantt chart libraries available for development teams today. But before we get started, let us answer two important questions.
Table of contents:
- What Is a Gantt Chart in Project Management
- Where PM Industry is Going in 2026
- Why Use JavaScript Gantt Chart Libraries
- Overview of JavaScript Gantt Components for Effective Project Management
- Comparison Table of JavaScript Gantt Chart Libraries
- Suggesting JavaScript Gantt Chart Use Cases
- Wrapping Up
- FAQ
What Is a Gantt Chart in Project Management
Conceived by American mechanical engineer and management consultant Henry Gantt in the 1910s, this tool quickly gained recognition in business circles for its simplicity and effectiveness in project management. Initially, Gantt charts were drawn on paper as simple bar charts that showed task durations over time without any task dependencies. Any changes required project managers to redraw charts entirely to bring workflow visualizations up to date. But the numerous benefits of this great tool far outweigh this inconvenience.
The business digitalization became a breakthrough moment for the Gantt chart, bringing it to a radically new level in terms of usability and functionality. Modern Gantt chart software enables project managers to apply the critical path method, track task progress, manage milestones, and allocate resources.
A Gantt chart correlates with the classic definition of project management by serving as a visual framework for its core processes: planning, scheduling, and controlling activities to meet specific goals within a limited period of time. The same remains true today. When projects become more complex in scope, scale, and pace than ever before, the role of a time-tested tool like the Gantt chart does not diminish, but grows.
Where PM Industry is Going in 2026
Just like in many other business areas, project management trends for 2026 revolve around the active implementation of smart AI technologies in PM software tools. In today’s fast-paced business environment, organizations consider AI tools as a potential game-changer for project managers.
It is expected that AI can be a driving force for replacing old methodologies by agile and hybrid approaches. The use of AI-powered project management already pays dividends in such aspects as task coordination, productivity tracking, resource optimization, risk assessment, and decision-making. Predictions for the future say that AI will contribute to autonomous project management with minimal human intervention, predictive project outcomes, and enhanced team collaboration.
At the same time, it is important to remember the imperfections of AI and concerns associated with its usage in real projects. AI technologies have not stood the test of time yet, but it has a huge potential for becoming a great addition to traditional proven tools like Gantt charts. So, it is natural to see that many popular ready-made tools with embedded Gantt functionality (Asana, Monday, ClickUp, Smartsheet, etc.) are AI-enabled. Vendors of UI Gantt components for building custom apps like DHTMLX are also actively engaged in preparing their products for the era of AI.
Why Use JavaScript Gantt Chart Libraries
Managing projects is challenging, but building tools that support this work is not easy either. Modern Gantt solutions not only visualize project tasks along the timeline, but also support complex business logic.
There are popular ready-to-use solutions for project management, such as Monday, ClickUp, and MS Project with a built-in Gantt view, but such products often have limited customizability and plenty of hidden costs. As an alternative, it is possible to create a custom Gantt chart that meets any specific requirements. However, implementing such functionalities from scratch demands much time and effort in the architecture, performance, and UX. The development process is also often associated with evolving requirements and tight deadlines. Therefore, many development teams rely on Gantt chart JS libraries to reduce development effort and accelerate the delivery of advanced scheduling features.
Now it is time to get acquainted with such Gantt tools in more detail.
Overview of JavaScript Gantt Components for Effective Project Management
The key objective of this article is to consider JavaScript Gantt components that cover popular use case scenarios rather than all options available on the market. Our listing includes UI Gantt solutions with built-in scheduling logic, visualization-oriented tools, framework-specific, and open-source options. The selected components differ in complexity, functional capabilities, extensibility, integration approaches, and licensing options, which often turn out to be the main selection criteria for such products. These tools are actively maintained and widely used in real-world projects, making them relevant options for JavaScript-based project management tools in 2026.
Such diversity should make it easier for teams to find the Gantt tool that complies with their technical and business requirements.
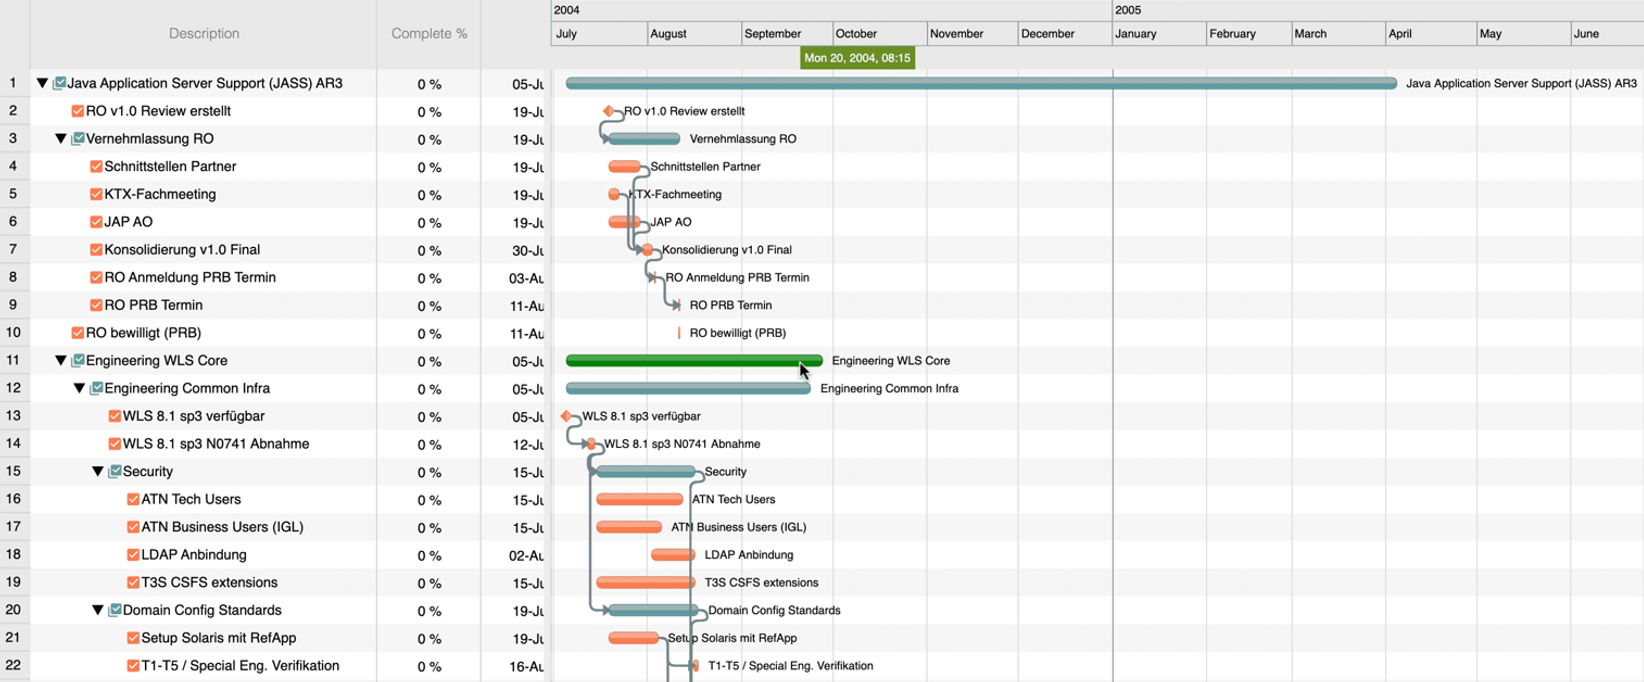
DHTMLX Gantt
DHTMLX Gantt is a comprehensive, enterprise-grade UI component designed to cover project management needs in modern web applications. DHTMLX’s strong reputation in the field is largely associated with the success and wide adoption of the JavaScript Gantt chart. When talking about this product, development teams often point out an essential combination of functional diversity and developer-friendly architecture that indeed helps speed up the delivery of custom enterprise apps.
Core Strengths and Distinctions
- Full-scale customization
Flexible customization is a killer feature of the DHTMLX Gantt component. The extensive API allows for modifying any visual, structural, and functional details of the Gantt chart. For instance, if the default theme or behavior of the Gantt chart is not suitable for a given scenario, there is certainly a way to introduce necessary adjustments.
- Seamless performance with large datasets
DHTMLX Gantt is regularly optimized to ensure stable performance in data-intensive apps. Even projects with 30,000+ tasks are rendered smoothly thanks to built-in techniques like dynamic loading and smart rendering.
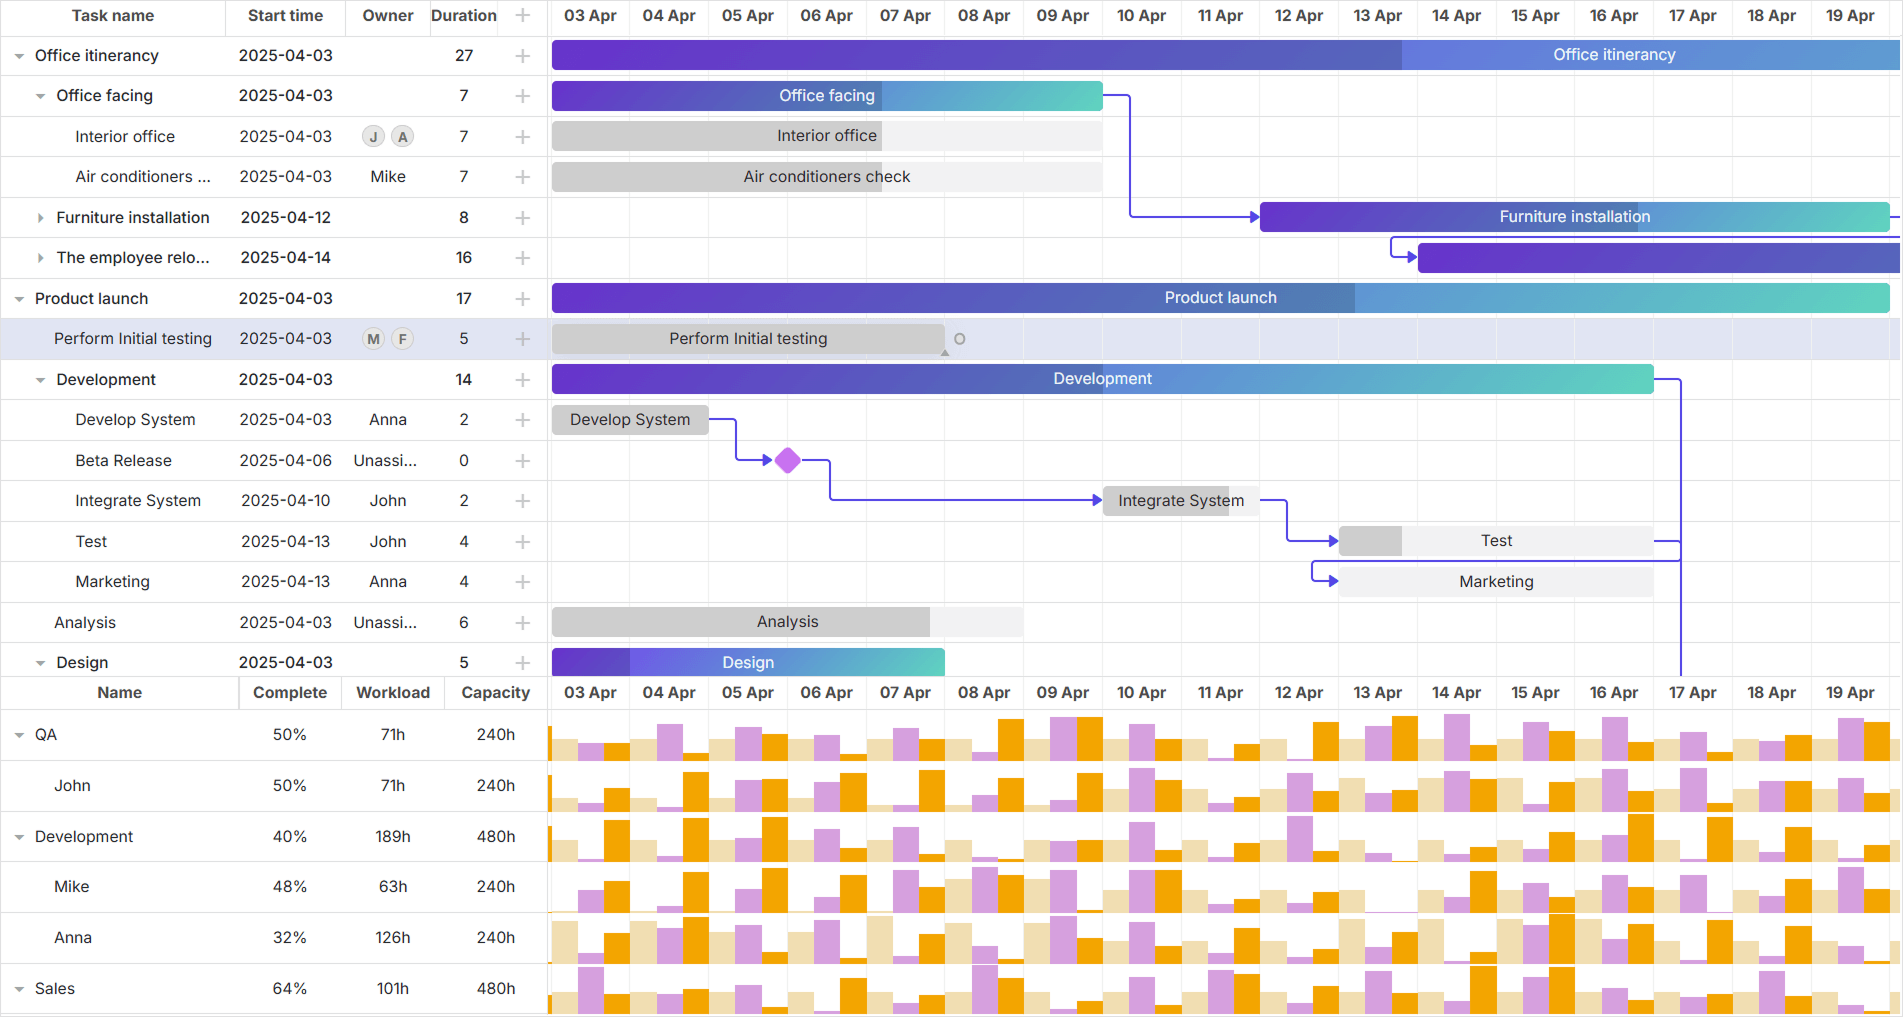
- Resource management
Visual workload balancing is one of the most popular functionality requests for Gantt-based apps, and DHTMLX Gantt helps implement it faster. For efficient resource (personnel, equipment, or other assets) management, DHTMLX Gantt comes with resource load and histogram charts that make it much easier to detect bottlenecks and avoid overloads.
- Auto‑scheduling and critical path, with an optional server‑side engine
DHTMLX Gantt comes with built‑in auto‑scheduling that automatically recalculates task dates when dependencies, constraints, or durations change, keeping the whole timeline consistent without manual adjustments. The component also supports backward planning from a fixed deadline and critical path highlighting, so project managers can immediately see which tasks drive the project completion date.
For teams that need to offload heavy calculations from the browser, DHTMLX offers a Node.js server module for running scheduling logic on the backend. This approach helps keep complex recalculations fast and stable in large projects while preserving a responsive client‑side UI.
- Flexible task structures
DHTMLX Gantt offers an effective approach to handling complex tasks and schedule optimization. Split task structures allow dividing large project activities into several separate stages (subtasks), enhancing scheduling flexibility in real-world workflows.
- Grid tools for organizing and navigating data
As Gantt charts grow in size and complexity, it is a necessity to have instruments for effective data organization and navigation. The grid section of DHTMLX Gantt can be enriched with the grouping extension that allows arranging tasks by various attributes (e.g. resources). Various filtering options for both tasks and resources make it much easier to narrow down large datasets and analyze relevant data. For instance, filters help quickly display resources allocated to a specific task or tasks with a high priority level.
- Export to PDF/PNG/Excel/iCal/MS Project/Primavera
DHTMLX enterprise Gantt chart JS component offers robust exporting capabilities, enabling end-users to save Gantt projects in popular formats, which can be printed and shared in offline discussions, presentations, and progress reports. There are two options for exporting Gantt charts: via a free online export service or a local export module (a more secure and suitable option for large charts).
These and many other useful features are fully covered in the multilingual DHTMLX Gantt documentation. The recent migration of the documentation to the Docusaurus platform ensures intuitive navigation across multiple guides and tutorials, with code snippets and live samples, integrations with popular technologies, and well-defined API references.
The rapid growth and adoption of AI technologies further amplify the potential of DHTMLX Gantt. To get a sense of how AI can strengthen Gantt, check our demo apps – AI Gantt Chart Maker and AI Gantt Theme Builder.
DHTMLX Gantt Licensing and Pricing Options
DHTMLX Gantt is available in two editions: the free-to-use Community Edition, which is licensed under MIT, and the commercial PRO Edition. The PRO version of DHTMLX Gantt is provided in the following packages:
- Individual ($799) for 1 developer
- Commercial ($1399) for 5 developers
- Enterprise ($2999) for 20 developers
- Ultimate ($5999) for an unlimited number of developers
Depending on the license type, DHTMLX Gantt licenses give perpetual distribution rights, access to the source code, 1 year of updates and tech support, export services, and usage in SaaS and Salesforce scenarios. Another great news is that the JS Gantt component is distributed with DHTMLX React Gantt without any extra fee. For covering more project management scenarios, DHTMLX Gantt can also be implemented in tandem with the JS PERT chart from the Diagram library and other DHTMLX JavaScript UI components, such as Scheduler, Kanban, To Do List, and Booking.
Launching a new business is never easy, so DHTMLX offers startups a 70% discount on a one-year license for Gantt, Scheduler, and Suite to kick-start promising young projects.
Webix Gantt
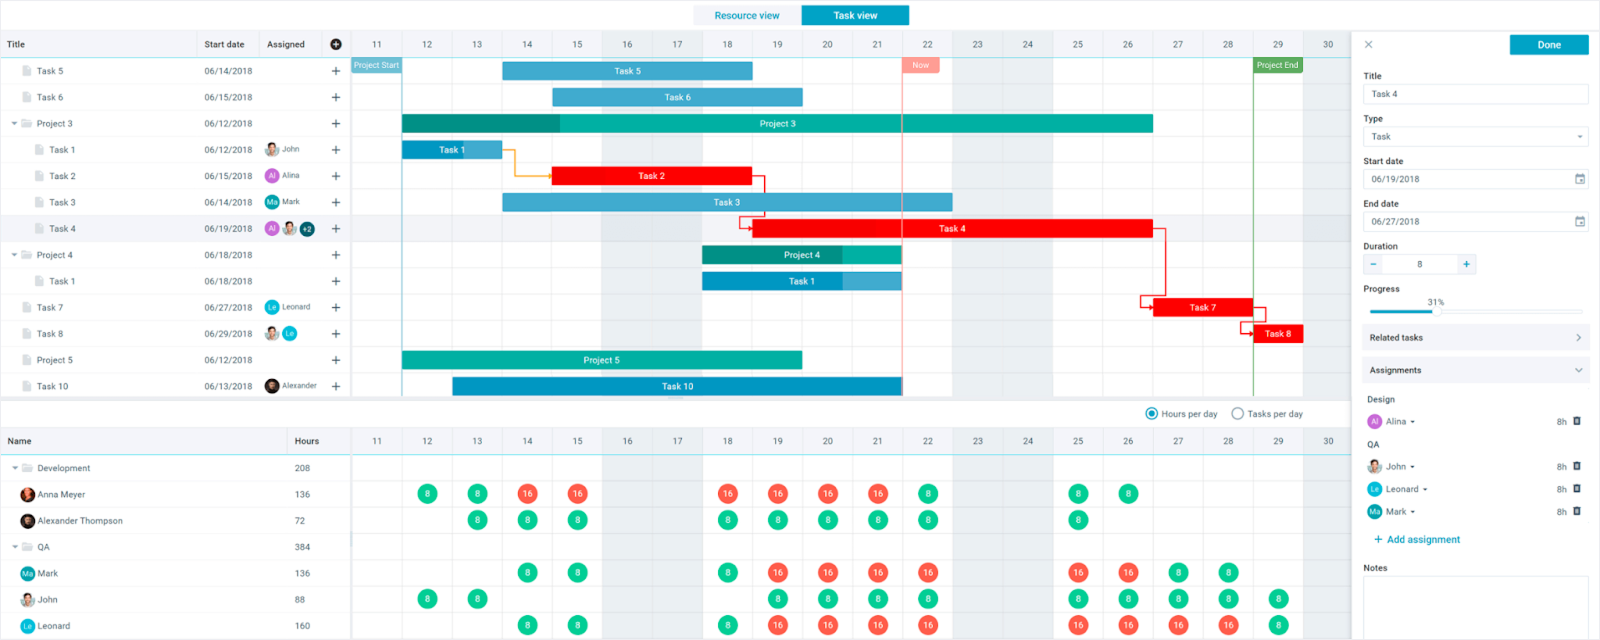
Webix Gantt is one of the complex JavaScript UI widgets provided by the Webix team for visualizing and managing project schedules over a specific timeline within Agile web apps. It adheres to the UI patterns of the core Webix library, offering straightforward configuration and visual consistency. Apart from core features for organizing projects and their elements, the widget also supports numerous features such as dependency tracking, critical path analysis, loading and assigning resources.
Core Strengths and Distinctions
- Ready-made application structure
Webix Gantt is delivered as a ready-to-use application with minimum configuration settings. It should help reduce setup efforts and allow quickly incorporating a functional Gantt chart into the app, especially Webix-based projects.
- Easy customization
This Gantt widget is built as a single-page application with the Webix Jet framework, and its UI architecture includes multiple stand-alone Webix views, connecting them via Jet Webix UI API. If needed, it is possible to modify specific Gantt settings or redefine the logic and behavior of any particular view separately. Thus, developers can gradually adapt Gantt parameters to certain requirements without rewriting the whole component.
- Compact mode
The compact mode comes into play when it is necessary to display Gantt charts on smaller screens (mobile devices, tablets, etc.). This mode switches Gantt from a full desktop view to space-constrained formats without violating the chart’s readability and usability.
- Native integration with other Webix widgets
As a part of the Webix ecosystem, the Gantt widget shares common data handling mechanisms and interaction patterns with other numerous widgets included in the library. This makes it easier to create cohesive UIs, including various Webix widgets. For instance, Webix Gantt and Scheduler can process the same data, so it can be convenient to use them both for visualizing project workflows.
The Webix Gantt documentation provides a well-structured overview of the widget, covering installation instructions, configuration options, customization opportunities, and other useful info. The acquaintance with the API reference and the How-To section will help unlock deeper customization scenarios. There is also the Gantt User Guide that describes the main Gantt capabilities at the end-user level.
Webix Gantt Licensing and Pricing Options
Webix Gantt Chart is distributed only under commercial terms. Here are two currently available options:
- One Project License (starts at $798) for 2 developers
- Unlimited Projects License ($1298) for up to 5 developers; can be used in SaaS products
For scenarios that require not only Gantt but also other PM tools, Webix offers bundles that include 14 additional complex widgets, such as Kanban, Scheduler, Spreadsheet, and more.
Syncfusion Gantt
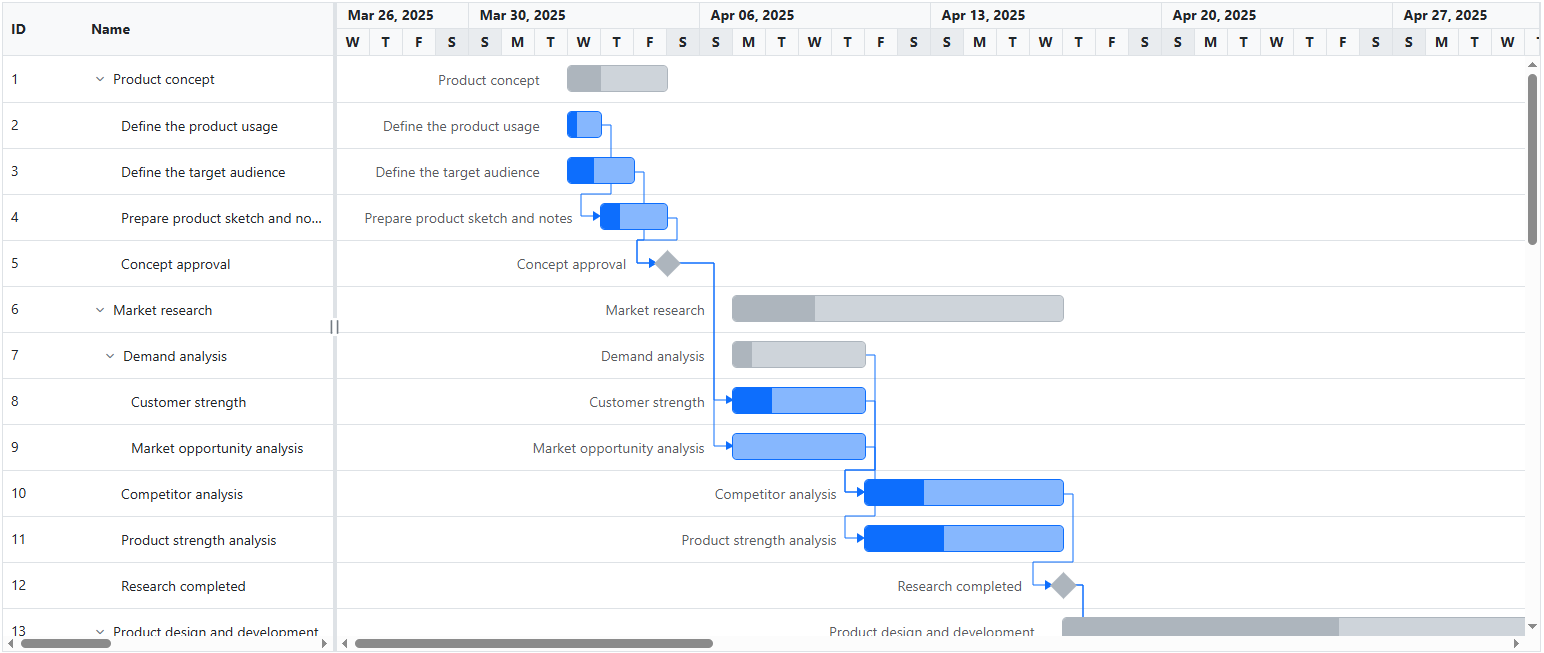
Syncfusion Gantt is a JavaScript UI control that provides a UI for scheduling and managing projects. Although it can be used as a standalone tool, it is tightly integrated into the UI ecosystem built around the Essential JS 2 library. This project management control benefits from shared design principles, unified APIs, theming, interaction patterns, and compatibility with other Syncfusion JS controls. It simplifies the development of web projects based on the Syncfusion UI tooling.
Core Strengths and Distinctions
- Grid-level data control and navigation
Syncfusion Gantt puts a lot of emphasis on how project data is laid out in the grid. For instance, it is possible to pin columns with important data, quickly organize data via column menus, or span columns across rows to better reflect complex task structures. This makes the component easier to adapt to wide tables and data-heavy project views.
- Toolbar actions
This JS control is shipped with a configurable toolbar element that gives quick access to common project actions. Using the toolbar, it is easy to add, search, edit, or delete records. Depending on the project needs, the toolbar can include built-in and custom options.
- Dependencies validation via UI
When a user’s edit action (such as dragging a taskbar or changing a date) violates existing task dependencies, Syncfusion Gantt provides a pop-up dialog for prompting users to select the mode to validate taskbar editing before saving. It helps prevent invalid or conflicting dependencies when users edit tasks without the need to delve into the entire dependency structure.
- State persistence
Syncfusion Gantt provides built-in support for state persistence. This mechanism ensures that the Gantt’s state is retained in the browser storage between sessions. As a result, user-applied settings, such as filtering, sorting, and column order, remain intact even after reloads or moving to the next page within the browser.
- Timezone-aware scheduling
By supporting time zones, Syncfusion Gantt guarantees timing consistency for scheduling operations in the Gantt chart. This is especially important for projects involving users from different regions.
- Robust online theming
Syncfusion provides the online Theme Studio tool for creating custom appearances for Gantt charts. The tool includes plenty of styling settings for creating new designs based on predefined themes without code manipulations.
Other functional capabilities of Syncfusion Gantt and controls included in the library are described in the documentation with the help of code examples and demos. The documentation also includes options for suggesting new features, edits, and downloading in PDF. At the same time, the Syncfusion Gantt API docs don’t always include code samples, so certain properties or methods may require clarification from related guides or demos.
Syncfusion Gantt Licensing and Pricing Options
Since Syncfusion Gantt is a part of the Essential JS 2 library, it cannot be purchased separately. To get any details on available licenses and prices, you need to request a quote. It is known only that Syncfusion’s commercial licenses are subscription-based.
Bryntum Gantt
Bryntum Gantt is a JavaScript tool aimed at facilitating the delivery of Gantt views for planning and managing projects in web interfaces. It offers a predefined and structured approach to scheduling workflows. The component focuses on providing built-in scheduling logic and smooth timeline interactions. It is possible to get different build options of Bryntum Gantt: a development version with source code comments, a minified production-ready Gantt build, and a custom one for optimizing the feature-set and bundle size.
Core Strengths and Distinctions
- Integrated scheduling engine
Under the hood, Bryntum Gantt is powered by an internal scheduling engine called ChronoGraph. It is compatible with the Node.js environment and should require no additional installation or configuration. Developed by the Bryntum team, this engine promises efficient handling of large datasets, including tasks with dependencies and constraints, effort and duration calculations, resolution of scheduling conflicts, and resource distribution. However, internal performance tests on large datasets showed that Bryntum Gantt falls behind DHTMLX Gantt in load times and RAM usage under heavy load.
- Animation-enhanced UI interactions
The component provides smooth UI interactions supported by animated redraws. Thus, it becomes easier for users to track how the Gantt chart responds to any changes in the project schedule.
- Flexible task editor
Bryntum Gantt comes with a functional task editor UI for introducing necessary changes in the project workflow in real time. By default, the editor includes separate tabs for managing common task parameters, attached files, resources, dependencies, calendars, constraints, and other parameters. If needed, the editor can be extended with custom settings.
- Smooth integration with other Bryntum components
At the technical level, Bryntum Gantt has much in common with other Bryntum components. For instance, it uses similar architectural concepts, data structures, and API patterns with other timeline components such as the Scheduler and Task board, making it easier to use such tools in a single app. Also, the grid section of Bryntum Gantt is based on the corresponding Grid widget, inheriting its score features like sorting, filtering, and summarizing. The basic Gantt chart can be enriched with 50+ common UI elements like chat boxes, menus, toggles, sliders, etc.
Bryntum Gantt is complemented with decent documentation that covers high-level concepts and low-level configuration details. It includes conceptual guides, integrations, API references, and interactive examples. The documentation is deep enough to form an understanding of how the component functions out of the box and how it can be adapted to specific project requirements.
Bryntum Gantt Licensing and Pricing Options
Depending on the application distribution model, Bryntum Gantt is offered under the End-User License (EUL) and OEM License. The End-User License covers non-commercial scenarios, where it is not required to pay to get access to the app. There are two EUL options for:
- Small Teams (from $1100 for 1 developer)
- Large Teams (from $9000 for 10 developers)
EUL is perpetual and non-transferable. For commercial projects and SaaS apps, it is necessary to purchase the subscription-based OEM license. This type of license allows redistributing Gantt-based apps to third parties for a fee. Prices for the OEM license are only available upon request.
Want to compare Bryntum and DHTMLX in depth? Read our detailed guide: DHTMLX vs Bryntum Gantt (performance, RAM usage, and pricing breakdown).
ScheduleJS Gantt
ScheduleJS is promoted as a JavaScript/TypeScript version of FlexGanttFX, known as a scheduling and resource planning tool for Java and JavaFX. Instead of providing any built-in business logic, ScheduleJS gives priority to timeline-oriented scheduling and user-defined interaction models. It means that the implementation of such features as critical path, auto-scheduling, and constraint rules is up to developers.
Core Strengths and Distinctions
- Canvas‑based rendering
By relying on the canvas-based rendering engine, ScheduleJS promises to maintain stable performance and consistent interaction behavior in data-heavy scheduling scenarios. This approach should eliminate heavy DOM manipulations frequently associated with performance issues when drawing and updating the Gantt chart. On the other hand, canvas rendering poses additional customization challenges.
- Angular-oriented by design
ScheduleJS targets Angular as its primary integration environment. The API design and usage patterns align with the Angular architecture. It includes utilities, directives, and architectural patterns, thereby simplifying the embedding of scheduling UIs in Angular apps.
- Interactive layout modes
In addition to the classic Gantt timeline, ScheduleJS offers other layout modes aimed at giving different perspectives on the same scheduling data. For instance, it supports the Agenda layout resembling a calendar and other timeline-based representations like high-low charts.
- Model layers for visual task organization
Model layers enable organizing activities into groups that follow the same rendering rules. Using these layers makes it easy to keep the timeline from becoming overloaded with data without altering the underlying project structure.
- Flexible selection behavior
With ScheduleJS, project tasks can be selected manually or programmatically via various patterns. For instance, it is possible to use a lasso approach that is convenient for selecting a group of tasks. The library allows specifying a custom response to such a selection, like highlighting or batch editing.
The Developer Manual can provide a general overview of ScheduleJS and its capabilities, but when diving into the technical details, things are not so clear. The API descriptions are brief, code examples are sparse, and navigation is not always intuitive. All that gives a mixed impression.
ScheduleJS Licensing and Pricing Options
There are licensing plans for three types of use: internal use, SaaP, and OEM bundle.
- Schedule Enterprise (from 1500 €) for 1 developer
This perpetual license includes a 1-year subscription to new versions, support, and maintenance. The library is shipped with a free proof-of-concept project designed to reduce the learning curve.
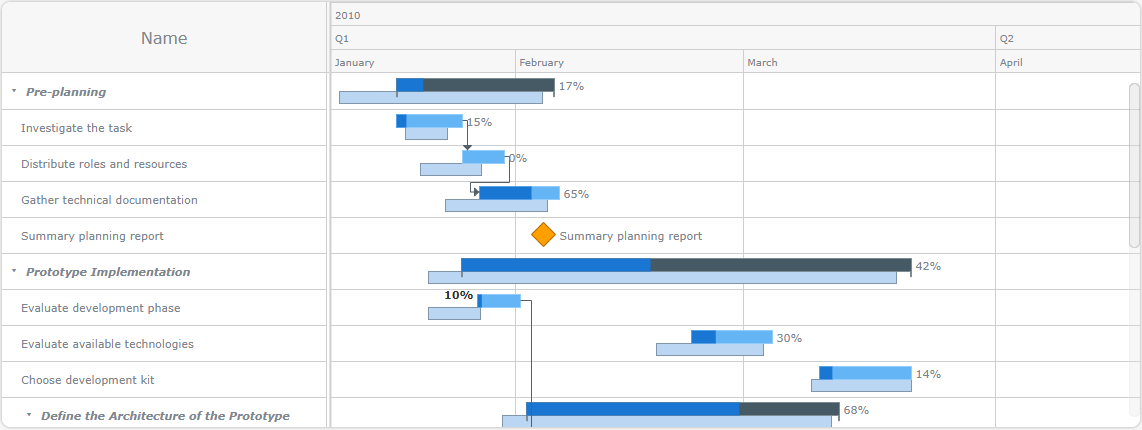
AnyChart Gantt (AnyGantt)
AnyGantt is a client-side Gantt component designed by the AnyChart team for cross-platform and cross-browser Gantt chart visualizations. This Gantt solution allows creating an interactive Gantt chart in JavaScript that clearly illustrates the project workflow and resource allocation. Also, AnyGantt uses the GraphicsJS library that provides a foundation for rendering, animation, and interactivity.
Core Strengths and Distinctions
- Visualization-first approach
The primary purpose of AnyGantt is to serve as a visualization layer for project schedules with dependencies and resources. It relies on SVG rendering to deliver presentation-ready Gantt charts that scale cleanly across different screen sizes and resolutions. AnyGantt lacks any advanced capabilities for workflow automation, but it still supports common features for managing projects within a Gantt chart.
- Two Gantt views
AnyGantt allows data to be visualized in two Gantt views: Project and Resource. The Project view is responsible for depicting the workflow, while the Resource view helps monitor the use of available assets. Dividing these aspects into two separate views may be helpful in large projects, where information density is often overwhelming.
- Support for legacy browsers
AnyGantt maintains compatibility with older browsers (including IE6), which can still be a requirement in enterprise environments. For instance, it is a practical option for teams working under strict IT or long-term support policies.
- Smooth integration with other AnyChart products
AnyGantt shares a consistent API with other charting solutions provided by the AnyChart team. It means a Gantt project can be easily enriched with other chart types for more informative visualizations.
The AnyGantt documentation is a comprehensive source of information about the product. It includes info-packed guides with easy-to-understand explanations of AnyGantt features with multiple code snippets. The API reference includes valuable descriptions of items used to configure Gantt tasks, resources, and scales.
AnyGantt Licensing and Pricing Options:
- Internal ($799) for 1 developer
- SaaS ($1499) for 10 developers
- Enterprise (upon request)
- OEM (upon request)
The Internal and Enterprise options are intended for internal use only. For SaaS projects, it is possible to choose either perpetual or annual licensing options. The use of AnyGantt in re-distributable and on-premise projects requires the OEM license. During the license period, users are promised to receive AnyGantt updates and 2 to 10 hours of tech support.
Highcharts Gantt
Highcharts Gantt is a JavaScript Gantt solution built on top of the Highcharts library, developed by Highsoft and primarily aimed at visualization-driven use cases. It extends the core Highcharts functionality with timeline-based visualizations for task allocation and resource coordination. The component emphasizes visual clarity, responsiveness, and seamless integration with other chart types. It is commonly used in dashboards, reporting tools, and analytical applications where project data needs to be displayed alongside other charts.
Core Strengths and Distinctions
- Developed with strong clients’ participation
Highcharts Gantt has evolved alongside the broader Highcharts ecosystem, with many features influenced by feedback from long-term customers. As a result, the Gantt component follows established Highcharts standards and responds to clients’ requirements for workflow visualizations.
- SVG-based rendering
Highcharts Gantt uses SVG as a primary engine for rendering tasks, dependencies, and timelines. It helps ensure clear and precise visuals across different screen sizes and zoom levels. This approach is particularly useful when charts need to be exported or embedded into reports or presentations.
- Integration with the Highcharts ecosystem
Highcharts Gantt can be used alongside other chart types from the Highcharts library, allowing teams to combine project timelines with analytical visualizations in a single UI. Shared configuration, theming, and export features simplify the development of visually intense dashboards and reporting tools.
The Highcharts Gantt documentation is concise, with only five guide-like sections dedicated to Gantt-specific features. The Gantt component inherits many features from the core Highcharts library, so developers can refer to the common sections of the Highcharts documentation for shared settings like tooltips, styling, and exporting capabilities. The API reference helps developers explore the full range of the configuration options available for Gantt.
Highcharts Gantt Licensing and Pricing Options
To obtain Highcharts Gantt, you will need to purchase the Highcharts JS library. Gantt is an add-on module that can be included in the following licensing options:
- Internal ($510) for 1 developer seat
- SaaS ($1007) for 1 developer seat
- OEM (upon request)
- Custom (upon request)
The indicated prices are for perpetual licenses, but subscription-based options are available as well.
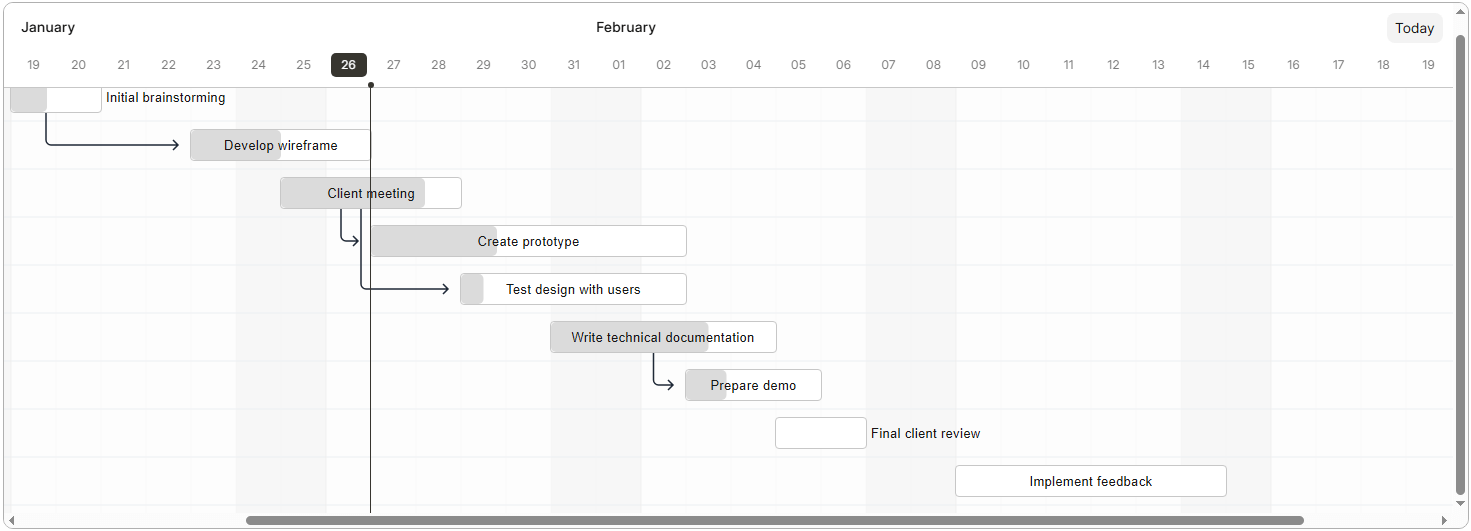
Frappe Gantt
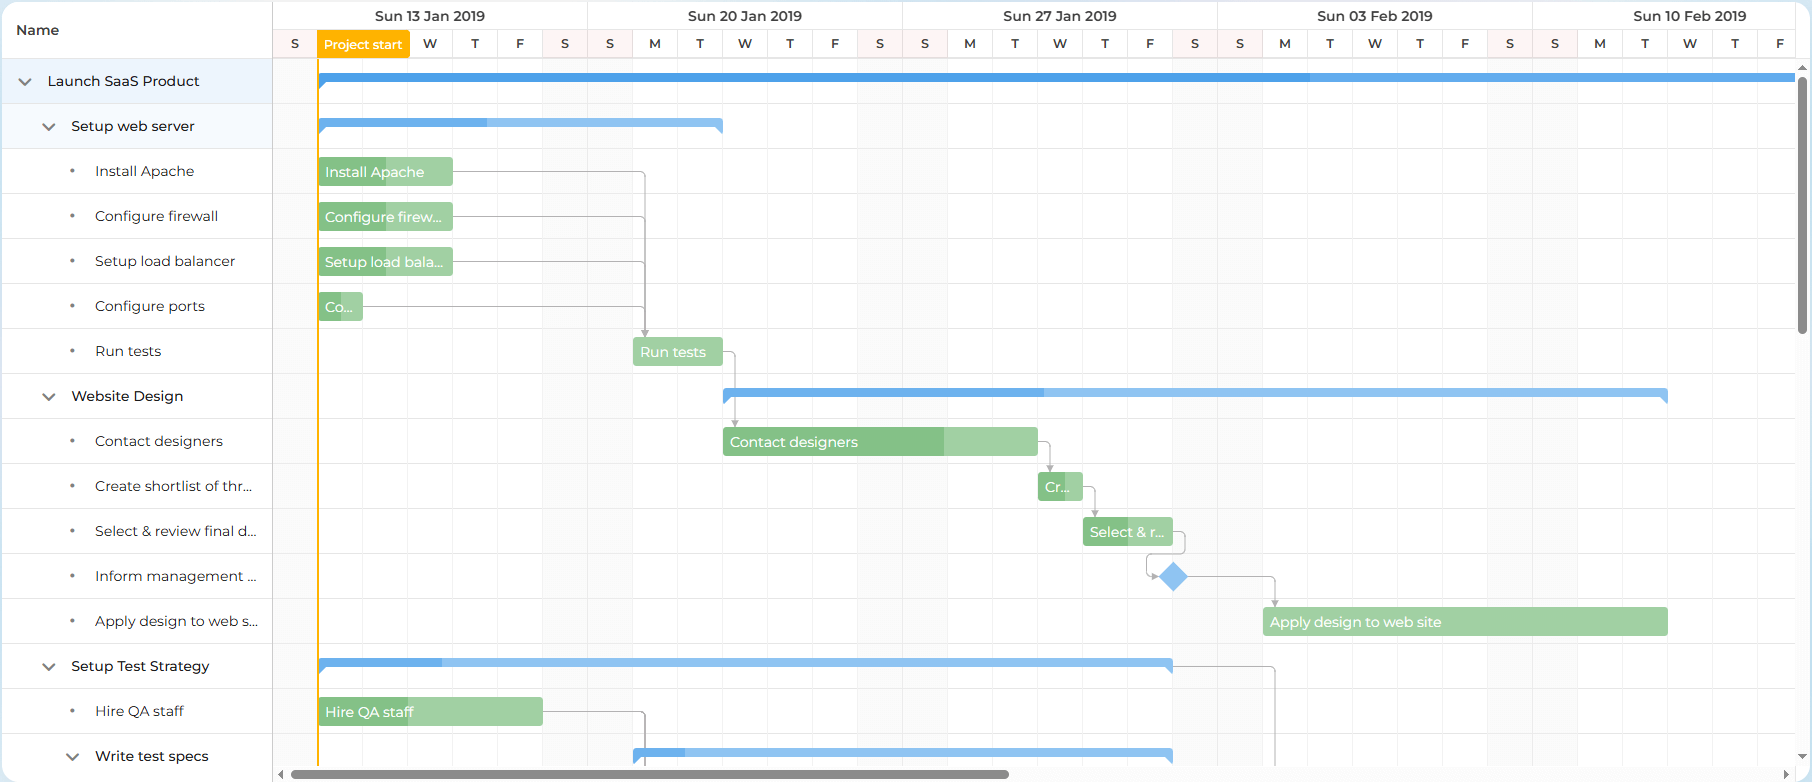
Frappe Gantt is a vivid example of a traditional Gantt chart for web apps, designed with simple UI and straightforward integration in mind. Despite its basic functional capabilities, this tool is a well-known option for delivering user-friendly Gantt UIs in web apps.
Before being released as an independent open-source solution, it was aimed at covering scheduling needs in the ERPNext platform.
Core Features and Distinctions
- Open-source foundation
Frappe Gantt is an open-source library that can be used free of charge in both non-profit and commercial projects. There are no hidden costs. The code is fully accessible for inspection and modifications. So any developer can easily customize the default Gantt and add necessary extensions.
- Lightweight
It is a lightweight JavaScript Gantt library with a small footprint (around 50 kB minified and 298 kB unpacked). That’s why it should not bloat the bundle size of any project management app.
- Ease of use
The library is designed to be simple and minimalistic, focusing on core Gantt features (tasks visualization, drag-and-drop UI, dependencies, timescales), making it easy to understand and implement. As a result, it allows building Gantt charts with minimal setup.
- Clean default UI
Frappe Gantt comes with a clean default appearance that requires minimal configuration to look acceptable in real projects. The Frappe team acknowledged that they drew inspiration from DHTMLX as well as Google Gantt for the initial design of their Gantt chart.
- Active community
The library has an active open-source community supported by members of the wider Frappe ecosystem and ERPNExt users. It facilitates the active development and further growth of the project.
Frappe Gantt Licensing and Pricing Options
Like DHTMLX Gantt Community Edition, Frappe Gantt is distributed under the MIT License.
Taking into account the open-source nature and simple API of Frappe Gantt, it is not surprising that the documentation of this project is clear but brief.
Now you have a general idea about popular JavaScript Gantt components and their distinctive features. However, it is unlikely to be sufficient when selecting this type of tool for a real project. Let’s dig deeper.
Going Beyond Pure JavaScript
While pure JavaScript Gantt components remain a default choice, there is no denying that many modern project management apps are based on top front-end frameworks. In such cases, teams often prefer UI components that fit in smoothly into framework-based workflows.
One popular approach is to use special Gantt wrappers that simplify integration. At DHTMLX, we offer such solutions for React, Angular, and Vue (coming soon). Designed to align closely with specific architectural patterns and ecosystems, these wrappers make it much easier to bring the power of the mature DHTMLX JS Gantt frameworks’ environments.
For an even more convenient development experience, it is necessary to use Gantt components built natively for particular frameworks. But there are not so many of them that are appropriate for production use. One good example is SVAR Gantt. This library can be used for modern project and task management applications that need a Gantt component built specifically for React, Svelte, or Vue, with quick setup, flexible UI customization, and rich scheduling capabilities.
Comparison Table of JavaScript Gantt Chart Libraries
Choosing the right tool for implementing a web app’s core functionality is a major decision that can significantly impact the project’s long-term success. Functional capabilities, quality of documentation, and licensing terms are often decisive points for such choices, but they are not the only ones. It is also important to consider opportunities for hands-on product evaluation, how well such tools fit into different technology stacks, what level of vendor assistance can be expected during the development stage, and whether Gantt charts can be combined with trendy technologies like AI. In our case, we address all these questions using a comparative table.
| Criteria | DHTMLX Gantt | Webix Gantt | Syncfusion Gantt | Bryntum Gantt | ScheduleJS | AnyGantt | Highcharts Gantt | Frappe Gantt |
| License type | perpetual | perpetual | subscription | perpetual for EUL, subscription for OEM | perpetual | both | both | – |
| Open-source version | Community edition under the MIT license Stars on GitHub – 1,8k npm weekly downloads – ~31k |
no | no | no | no | no | no | MIT version Stars on GitHub – 5,8k npm weekly downloads – ~50k |
| Trial version | free 30-day trial version | free 30-day trial version | free 30-day trial version | free 45-day trial version | free proof of concept project for potential customers | trial version without any time limits | Gantt can be tested without a license key | no, it is free to use |
| Live samples | 850+ | 30+ | 50+ | 150+ | not found | 700+ | 12 | not found |
| AI-driven demos or tools | demo apps (AI Theme Builder, AI Gantt Maker), DHTMLX MCP server | not found | basic samples created with the use of AI | not found | not found | not found | GPT-powered chart editor | not found |
| Top UI frameworks support (React, Vue, Angular) | yes | yes | yes | yes | only Angular | yes | yes | yes (community-made wrappers) |
| Built-in TypeScript support | yes | yes | yes | yes | yes | yes | yes | no |
| Tech support channels | email, forum, Stack Overflow, GitHub | documentation, email, community forum | public forums, feedback channels, and a ticket-based support system | support forums | ticket submission via website | documentation, GitHub community, email | chat support, email, tickets, Stack Overflow | forum, GitHub |
| Request a live demonstration | yes | no | yes | yes | yes | no | no | no |
| Built-in themes | 8 | 7 | 5 | 5 | not found | 16 | 3 | not found |
| Content security policy | yes | yes | yes | yes | no | no | no | no |
| Support for touch devices | yes | yes | yes | yes | yes | yes | yes | yes |
Suggesting JavaScript Gantt Chart Use Cases
By bringing together all the above, we get a more or less consistent picture of the best Gantt chart libraries in 2026 and can reasonably suggest their possible use case scenarios:
- DHTMLX Gantt is best suited for: enterprise-level project management systems and resource planning applications that demand high performance under heavy loads, end-to-end customization, and full control over the UI behavior and resource allocation. It is also suitable for open-source projects that previously favored GPL-licensed or free alternatives.
- Webix Gantt is best suited for: Agile project planning and management systems that require a Gantt view with easy setup and customization.
- Syncfusion Gantt is best suited for: teams standardized on Syncfusion’s ecosystem and cross-platform applications requiring consistent UI patterns.
- Bryntum Gantt is best suited for: project management apps combining built-in scheduling rules, fluid interactions, and robust task management.
- ScheduleJS is best suited for: Angular applications with a focus on smooth rendering of dense timelines, and projects migrating from FlexGantt.
- AnyGantt is best suited for: project management dashboards and reporting tools, where the Gantt chart complements analytical views rather than drives scheduling logic.
- Highcharts Gantt is best suited for: visual-first project timelines and applications already using Highcharts.
- Frappe Gantt is best suited for: education projects, prototypes, MVPs, and open-source tools where minimal bundle size and fast setup are priorities over feature depth.
Wrapping Up
Each project management app based on a Gantt chart is unique in its technical requirements, budget constraints, delivery deadlines, and other considerations. This article may help you find answers to many questions that really matter when choosing the Gantt component for a web project, but there is one more crucial step before making the final choice. It is a practical testing of Gantt components in various scenarios.
So, start with a free 30-day trial version of DHTMLX Gantt and certainly try other Gantt charts to find the right one for your project in 2026.
FAQ
- Are Gantt charts still relevant for modern project management needs?
Absolutely. A Gantt chart remains in high demand since it covers essential project management needs that do not change much over time. Project managers still need a clear, time-based illustration of complex workflows with dependencies, priorities, and deadlines. That’s what Gantt charts do best.
- When is a Gantt chart essential for your project?
If a project is too straightforward or highly unpredictable, choosing a Gantt chart may be excessive. But it becomes a necessity for scenarios with interrelated stages, well-defined milestones, strict deadlines, and the need for resource coordination. With a Gantt chart, it is easier to identify potential bottlenecks and see how delays affect the entire project schedule.
- What is the difference between Gantt charts, PERT charts, and project timelines?
In short, these timeline-based tools serve different purposes. Gantt charts are used for scheduling and managing workflows. PERT charts usually come into play at early project stages of large projects for the analysis of task dependencies and potential risks. Project timelines provide a high-level overview of all project phases and milestones to keep everyone on the same page.
- What are the key selection criteria for JavaScript Gantt chart libraries?
There are plenty of feature-packed JavaScript Gantt components available today. But it is also important to see what lies behind solid feature sets and modern design. That is why it is important to pay attention to the quality of documentation, the availability of tech support, the frequency of updates, and the licensing terms. And certainly, the final decision cannot be made without a practical evaluation.
- Why is it so challenging to build a full-fledged Gantt chart from scratch?
It is easy to underestimate how complex Gantt chart functionality really is. The visuals may seem easy to implement, but the tricky part lies in the underlying scheduling logic. It is a core algorithm that automatically calculates, updates, and manages task dates, dependencies, and constraints in real-time. Also, we should not forget about the need for performance optimizations. All this will certainly require much time and effort. In many cases, using a mature JavaScript Gantt chart library turns out to be a better option.
- What is the impact of AI on such PM tools as the Gantt chart?
Currently, AI technologies have a positive, complementary effect on traditional PM tools like a Gantt chart. AI-driven software solutions increase planning and scheduling efficiency by automating tasks, forecasting risks, and improving accuracy. Vendors of UI Gantt components, such as DHTMLX, also see great potential in AI and strive to make their products AI-ready, for example, by providing AI demos and MCP servers that simplify integration with LLM tools.