We stay focused on maintaining the stability and reliability of DHTMLX products and enhancing your experience with them. To do that, we regularly deliver requested fixes and improvements for our JavaScript libraries. Today, you’ll get acquainted with updated PDF export modules for Gantt and Scheduler components and new patch versions of our Kanban component and JavaScript UI widgets library.
DHTMLX Gantt and Scheduler: Updated PDF Export Module
The export module is a widely used addon of our JavaScript Gantt chart and Scheduler. It enables end-users to save and share project information in various formats and therefore effectively communicate and analyze project data. Thanks to its secure and reliable way of exporting Gantt charts, the export module often becomes a preferable option for saving data in popular formats such as PDF. Thus, we always try to improve this functionality, taking into account the interests and requests of our customers.
Today, we are happy to highlight updated PDF export modules for our JS tools for project management apps. Most novelties are introduced in the PDF export module for Gantt, so we start with this product.
It should be noted that this update will be more useful to users who prefer the local export module. With our export server, it will work only for Gantt charts that are not large in size. Otherwise, only a part of the chart will be exported since the time limit for the export operation is 20 seconds.
Multipage Export in One PDF File
First of all, let us explain the necessity to export a Gantt chart by chunks and then merge them in a certain text format.
By default, Gantt data is exported to PDF on 1 page, but you can make it exported to multiple pages of popular sizes (A3 or A4). But the main issue here is that no matter how small the chart is, it rarely fits into the page size.
One solution to this problem is to change the zoom level (scale settings). If the minimum scale is displayed in years, then most likely the Gantt chart will be fully displayed on a single page of a particular size. But the downside here is that taskbars look small and it becomes hard to understand the project workflow.
Here is how the Gantt chart looks like in its full size:

When saving a Gantt chart with data covering one or a few years on a single page in PDF format and exporting data via the browser, you’ll get quite confusing images like the one below:
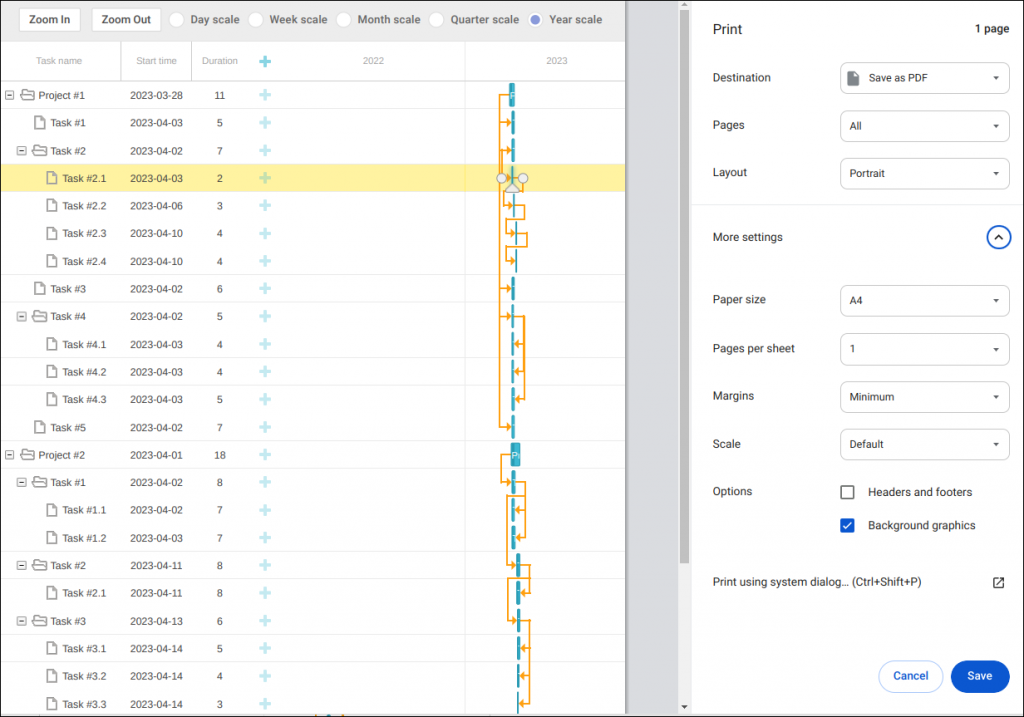
Once it is necessary to examine tasks in more detail (i.e. apply a smaller scale such as “Month” or “Week”), the Gantt chart won’t fit in.
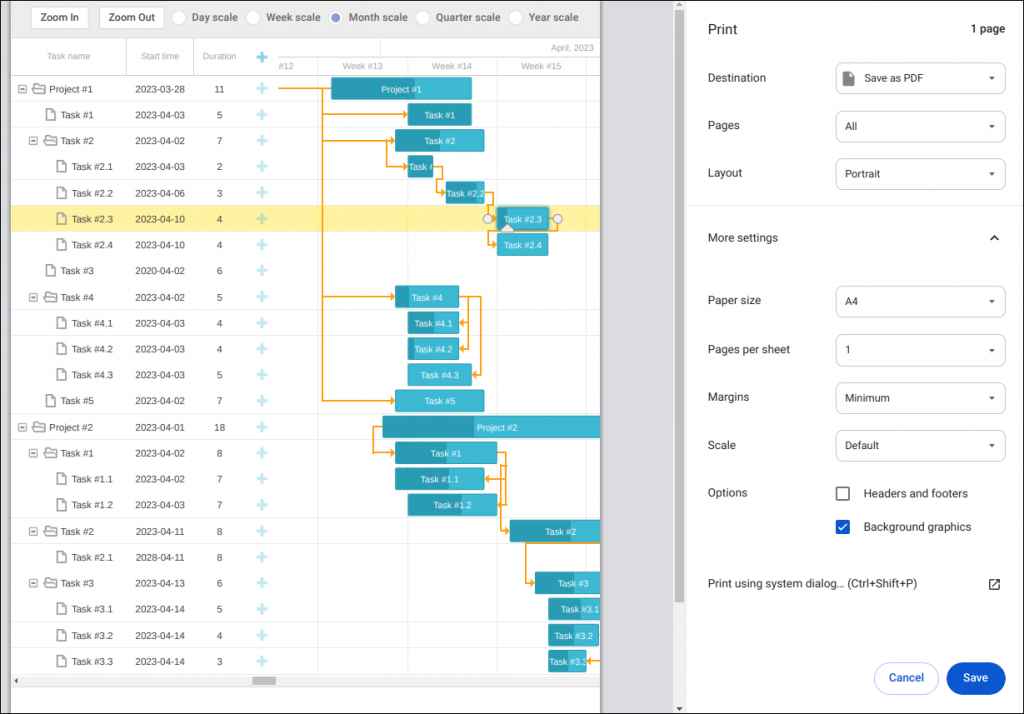
That is the reason why the Gantt chart should be exported by parts:
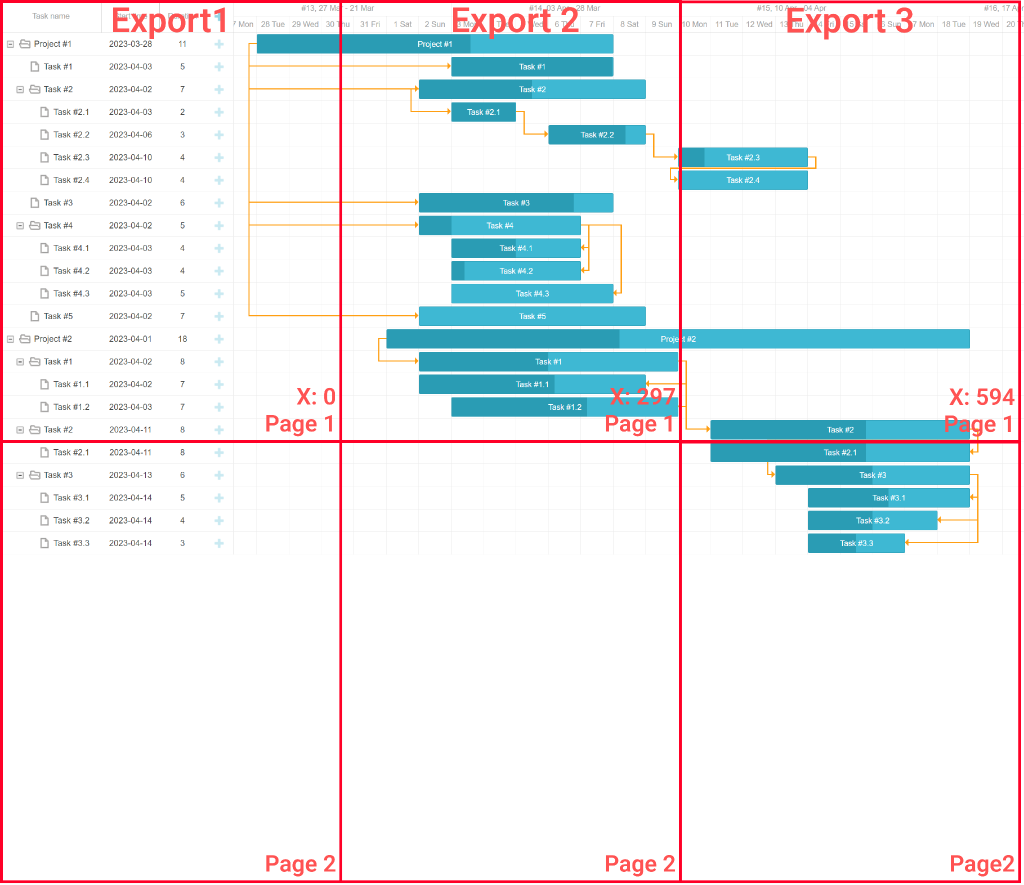
But immediately arises another question: how to put them together?
The new version of our Gantt export module offers a solution for this issue. Now you can specify the size format and enable a new merge_pages config. After adding this config, the export module will make several exports automatically and then merge them into a single file.
You can see how the exported Gantt chart with the “Week” scale is merged below:
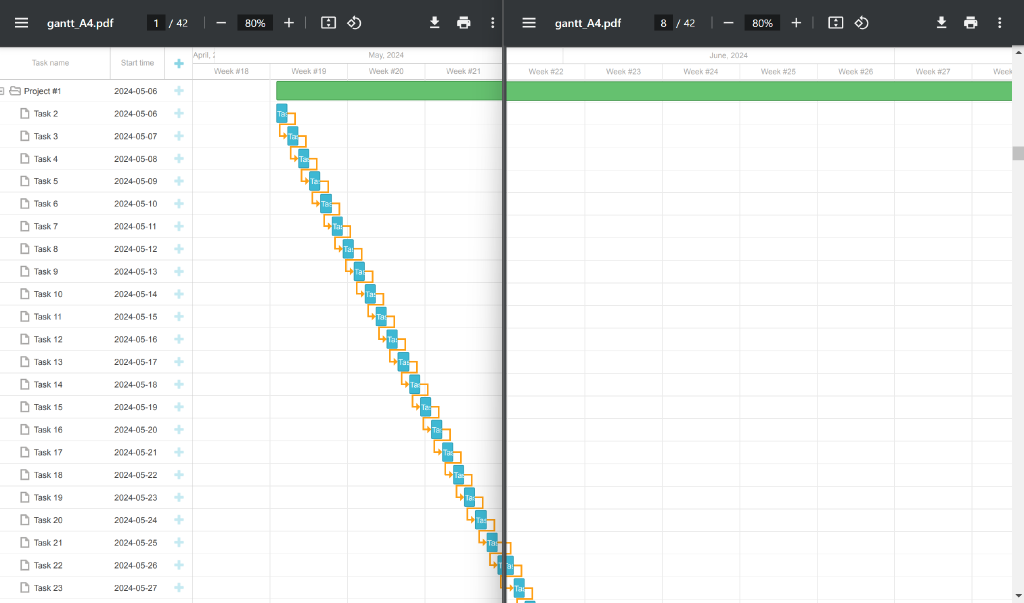
Thus, now it is possible to export the whole chart even at 100% scale and print it in the desired size format.
You can test how it works in practice using this snippet.
Improvements for Default Gantt Exporting
There is another problem that occurs with the default exporting of Gantt data. In this case, the Gantt chart is exported in its actual size, and rows with taskbars are not placed on another page. As a result, the exported tasks can be cut in half.
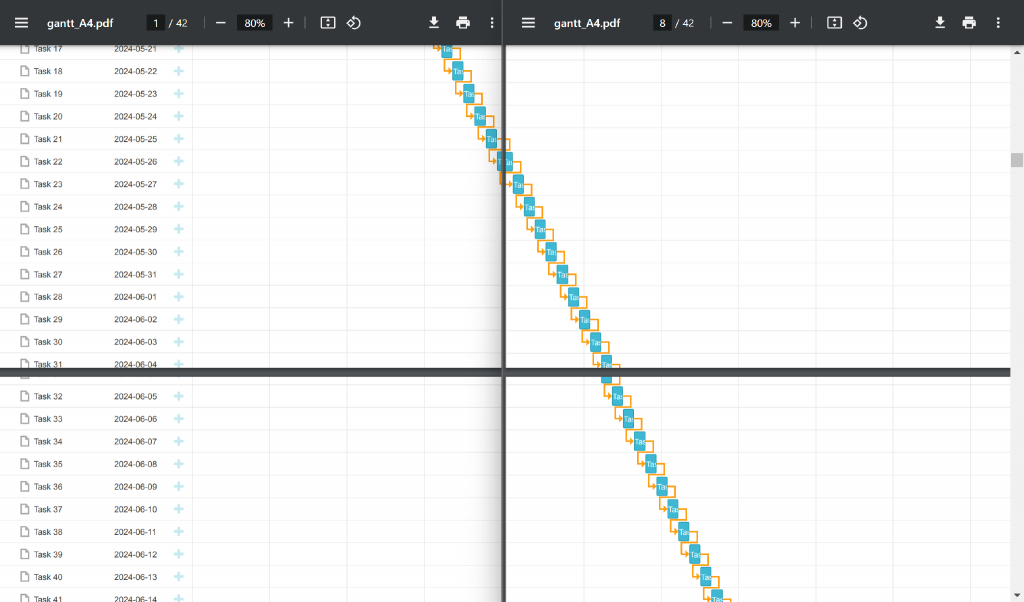
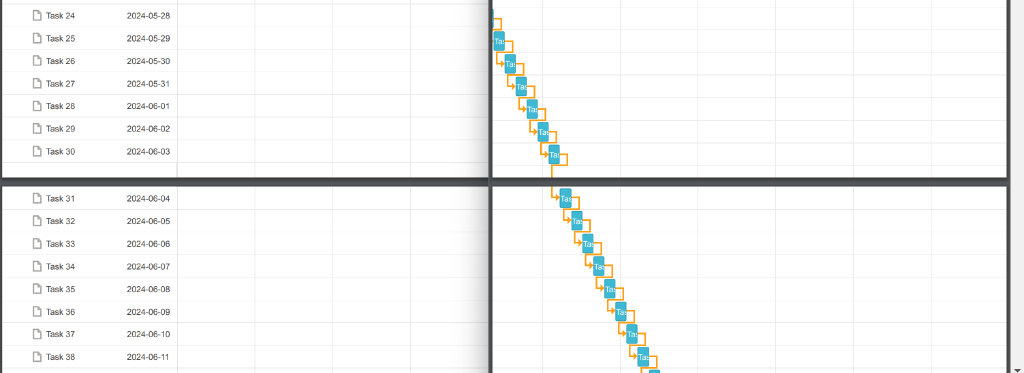
It can be solved easily only with grid and timeline rows of the Gantt chart. As for taskbars and dependency lines, they have absolute positioning. If you try to add any styles, they won’t work for these UI elements. Apart from that, the Gantt timeline can contain custom elements with any style. Therefore, the most appropriate solution is to add unscheduled tasks as blank rows before the export and delete them afterward when using the multipage export in one file.
That’s how it should look like:
Showing Grid and Timeline Headers on One Page
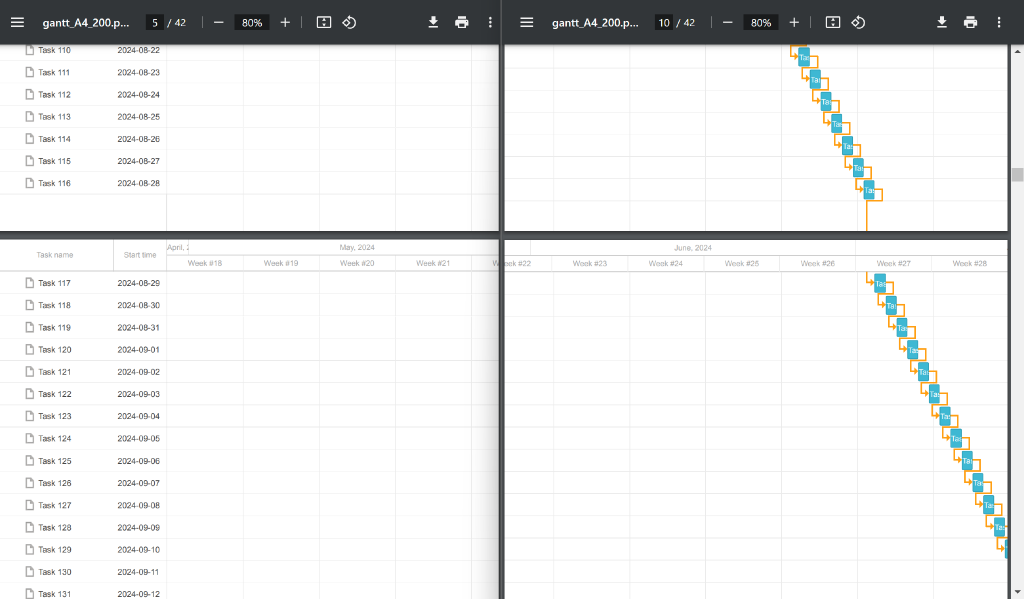
In addition, we also added the possibility to display grid and timeline headers on each page. Since these headers will cover the task rows, you need to apply a custom solution that adds empty rows between pages. This feature works properly only when the merge_pages config is enabled.
That’s what you should see in the UI:
But what if you need to make it work without the config? For instance, you want to perform several export operations and merge the files manually. You can do it using the following styles:
.timeline_cell .gantt_task_scale {
position: fixed;
top:0;
z-index:99999;
}
You can test how it works using this sample.
Apart from that, we also fixed several issues and irregularities in the PDF export module for DHTMLX Scheduler.
All in all, new versions of the export modules will contribute to the flexibility and usability of this popular functionality. It promises a better experience in exporting Gantt charts of any size. So it should become more convenient to collaborate with other members of the project team offline and use Gantt data in other project management tools.
DHTMLX Suite 8.3.10
8.3.10 (April 3, 2024)
- Calendar: the 29th of February isn’t rendered for some date formats (Fixed)
- Grid: row CSS isn’t applied in the exported Excel file (Fixed)
- Grid: row autoHeight fails on changing the order of columns by dragging (Fixed)
- Grid: сustom header sorting doesn’t work for the headers containing HTML (Fixed)
- Grid: incorrect filtering via comboFilter (Fixed)
Learn more in the documentation >
DHTMLX Kanban 1.5.12
1.5.12 (May 2, 2024)
- Intercept regression: return false does not prevent inner events (Fixed)
- Disabled files allow files (Fixed)
Learn more in the documentation >
Get access to the latest versions of our libraries and test them free of charge for 30 days.
Current clients may find the updated packages in their Client’s Area.