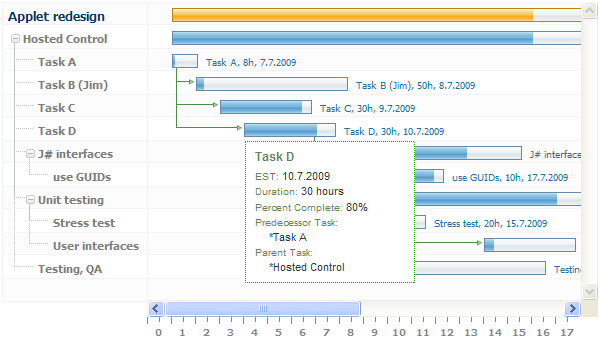
For those who build MS Project-like tools, we have released our new control – dhtmlxGantt, an interactive JavaScript Gantt chart.
A great feature set, a wide variety of options, flexibility, cross-browser compatibility, and powerful JavaScript API make this component really useful for creating superior project management applications.
Main features at a glance:
- Interactive, editable view (read-only is optional)
- Fast and smooth rendering
- XML serializable
- Dependency arrows
- Constraint checking
Use our Gantt chart to illustrate a project schedule. You can show the dependency relationships as lines between activities. Gantt charts can show current schedule status at a glance by using percent-complete shadings. Projects, tasks, and activities are comfortably organized into a tree structure (left of the chart), which can be expanded/collapsed by a single mouse click. Mouseover pop-ups show extended activity properties.

dhtmlxGantt Example
Initialize your chart directly from the server with XML (or optionally using JavaScript API). Then, in edit mode, you can create new activities or delete existing ones. You can move activities along the time line, resize them, modify their properties, and instantly see those changes. The component automatically applies all constraints and dependencies as you edit. Finally, you can save a new chart back to the server (in XML form) with a single function call.
It works perfectly in all major web browsers (IE, Mozilla, Firefox, Opera, Safari, Chrome). Enjoy!