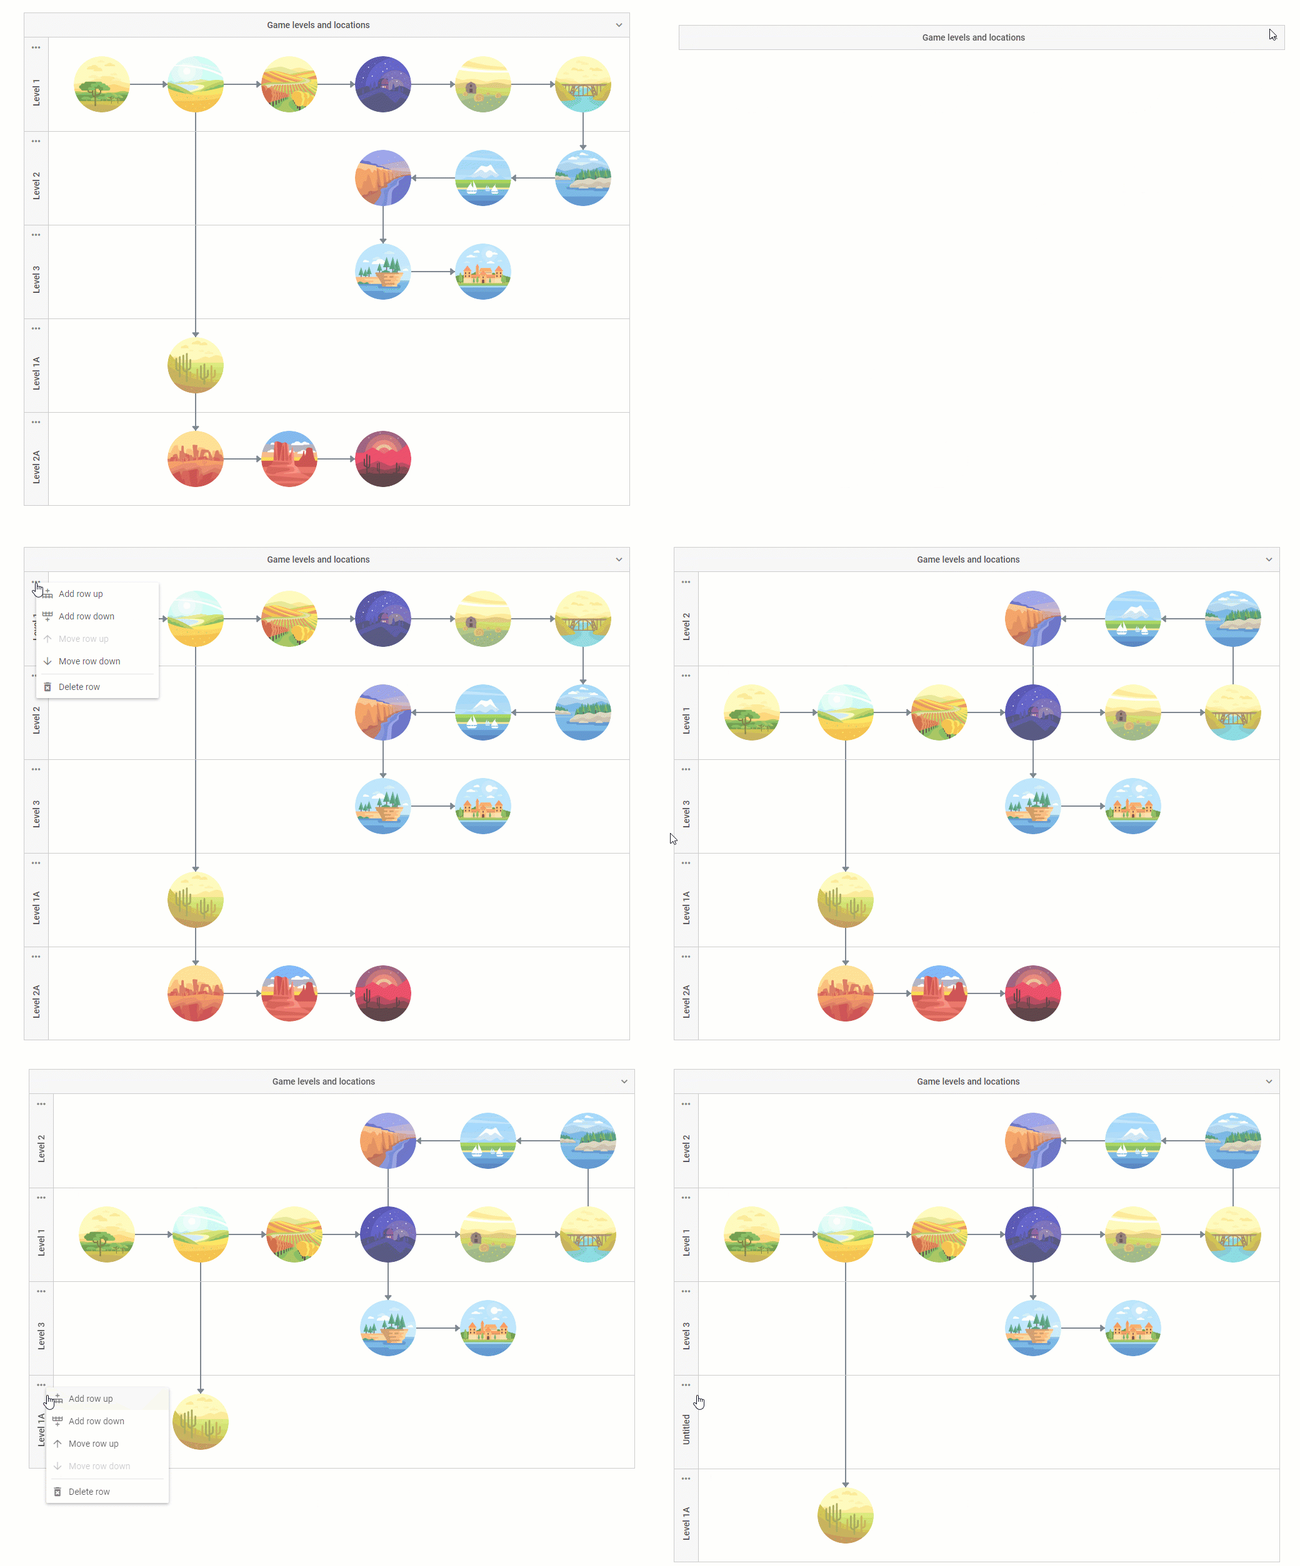
We are delighted to announce the release of the DHTMLX JavaScript diagram library 4.0. The major version brings out such sought-after elements as swimlanes and groups of items as well as integration demos with Angular, React, and Vue.js. Diagram editors become more flexible. The API is enriched with new events, methods, and configuration options.
Download the brand-new version 4.0 of DHTMLX Diagram >
Let’s uncover all the release features now!
Groups
V4.0 delivers the ability to set up a group of Diagram elements. Groups can comprise shapes as well as other groups. They serve to organize objects and visually separate them from each other according to some criteria. A group also enables users to manipulate elements included in it as one unit.
Groups are available for end-users in the left panel of the Diagram editor. However, they can also be created manually in the process of preparing a dataset by setting up a group object with the “$group” value of the type attribute. There is a wide range of configuration options that you can use to specify the appearance and behavior of a group.
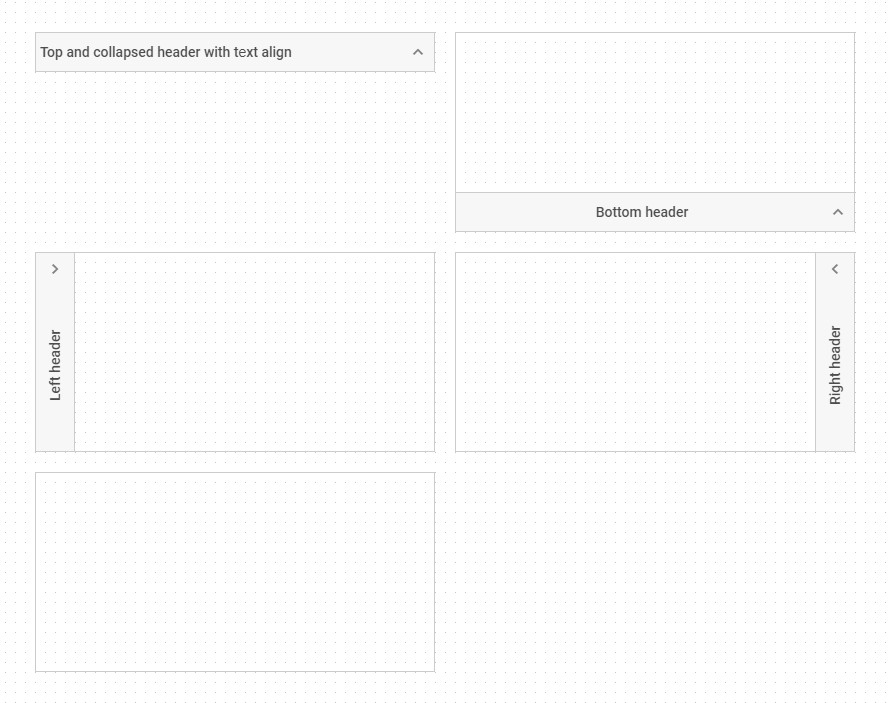
For instance, you can hide a group’s header, make it closable, editable, and position it at the top or bottom, on the left or right side of the group, as shown in the example below.
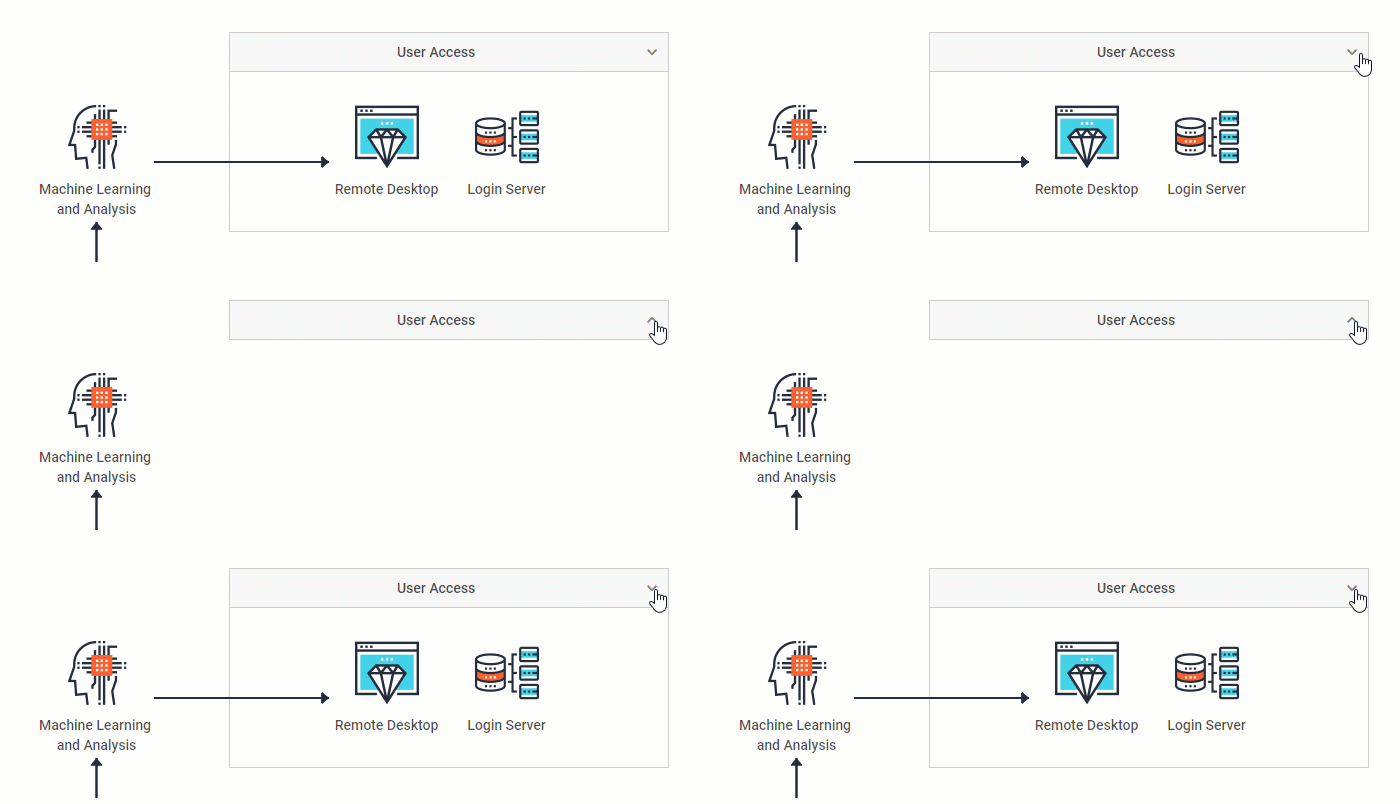
In the following example, there is a group containing two shapes. It has specific width and height as well as a closable header. Check the code snippet with a live preview >
type: "$group",
id: 1,
width: 400,
height: 200,
x: 0,
y: 0,
header: {
text: "User Access",
},
groupChildren: ["1.1", "1.2"],
},
{
type: "it",
id: "1.1",
x: 50,
y: 75,
text: "Remote Desktop"
},
{
type: "it",
id: "1.2",
x: 200,
y: 75,
text: "Login Server"
},
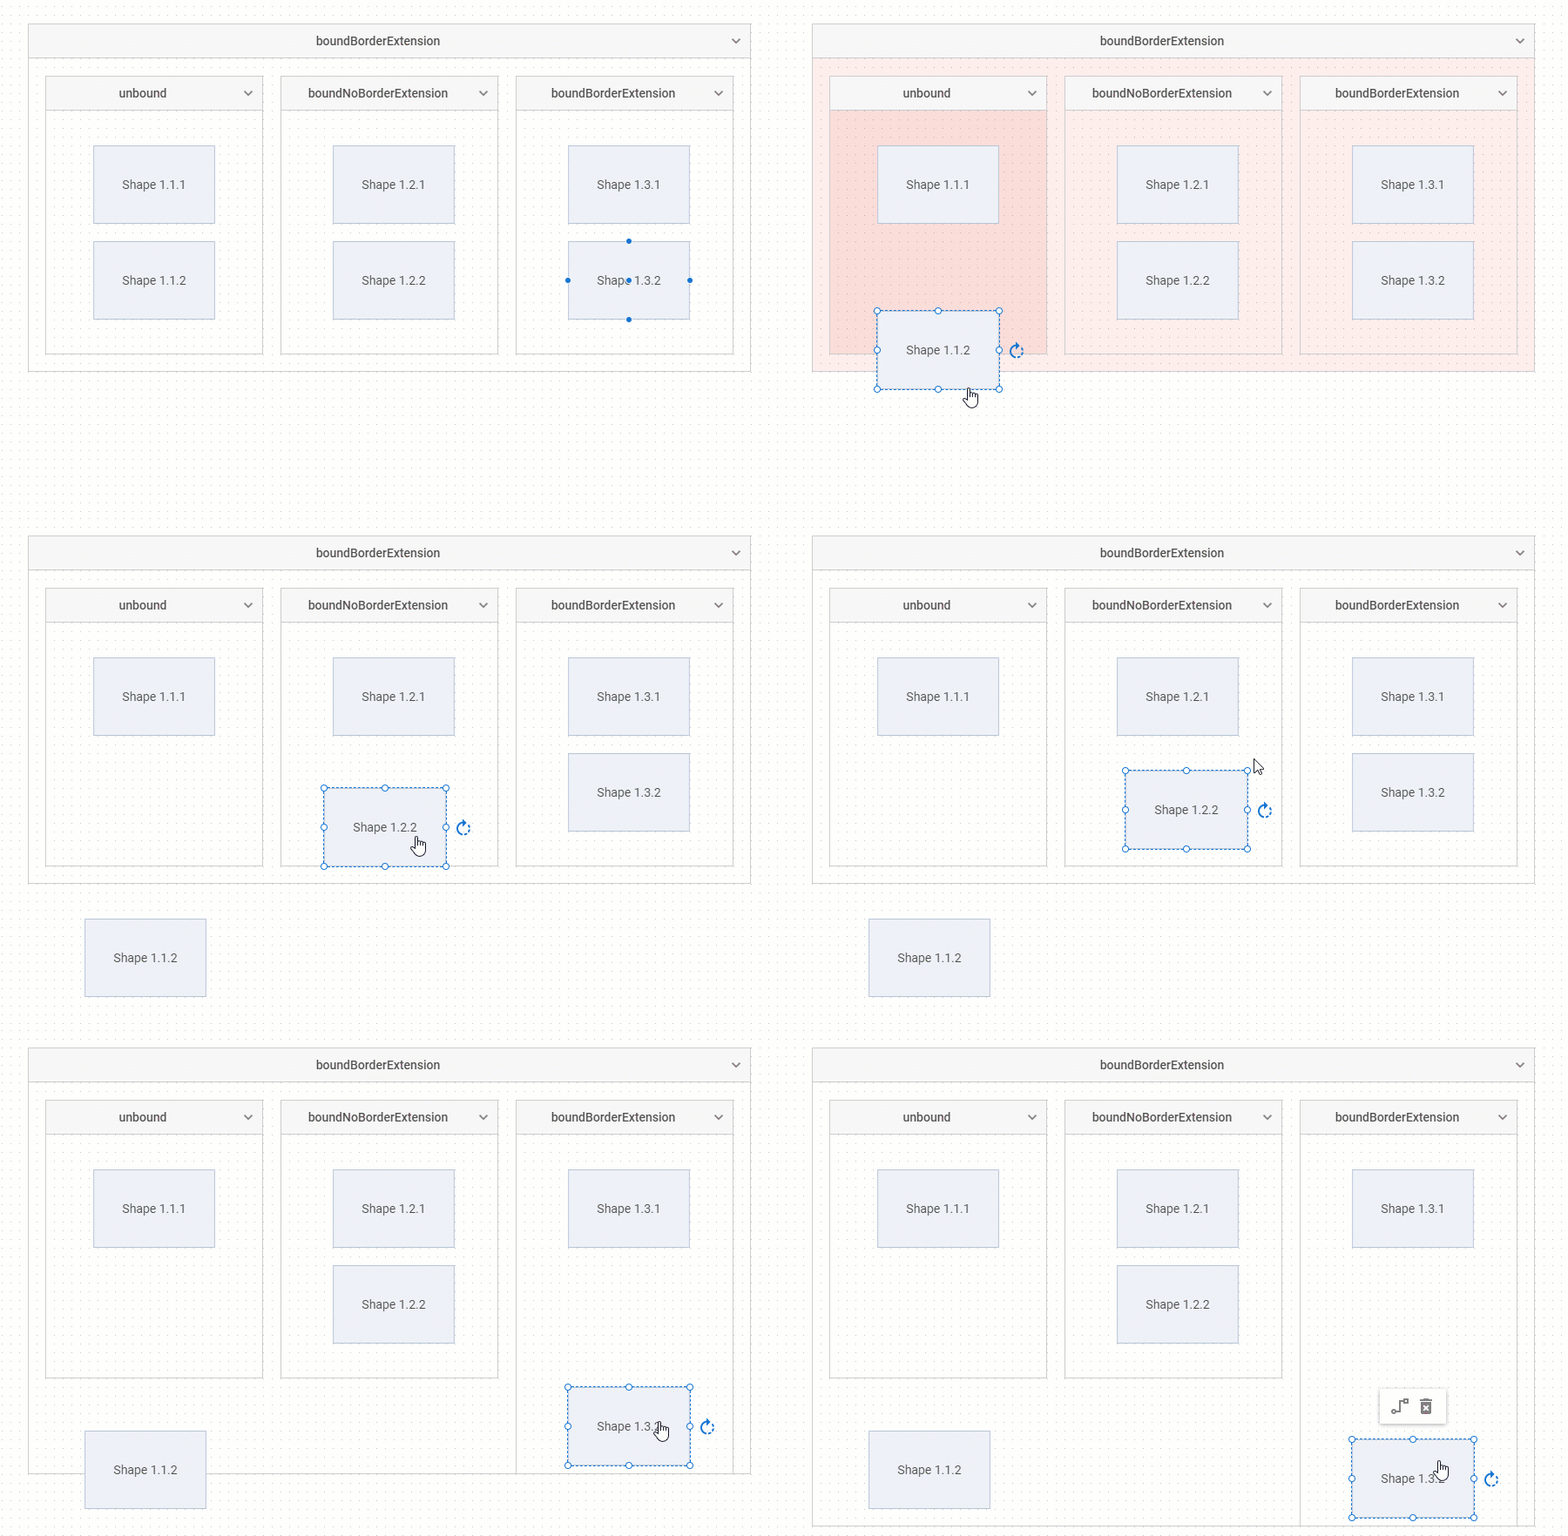
Additionally, you can configure the behavior of group items when a user is dragging them outside of the group via the groupBehavior and padding attributes of the exitArea object. Thus, you can allow an item to be moved in and out of the group, make the group borders expand when a user is dragging an item outside, or disable the drag-and-drop of items out of the group, as well as set the padding between an item and the edge of the group.
Swimlanes
The most wanted feature delivered in v4.0 is swimlanes. Swimlanes are rectangles divided into vertical or horizontal lanes or cells similar to a matrix. They can include shapes and groups of shapes. Swimlanes help to distinguish between different parts of a process or system.
To create a swimlane, you just need to set the “$swimlane” type of the swimlane configuration object and define its structure via the layout configuration property.
By default, DHTMLX Diagram swimlanes have no header and subheader. However, you can choose from a variety of configuration options to fine-tune your swimlane.
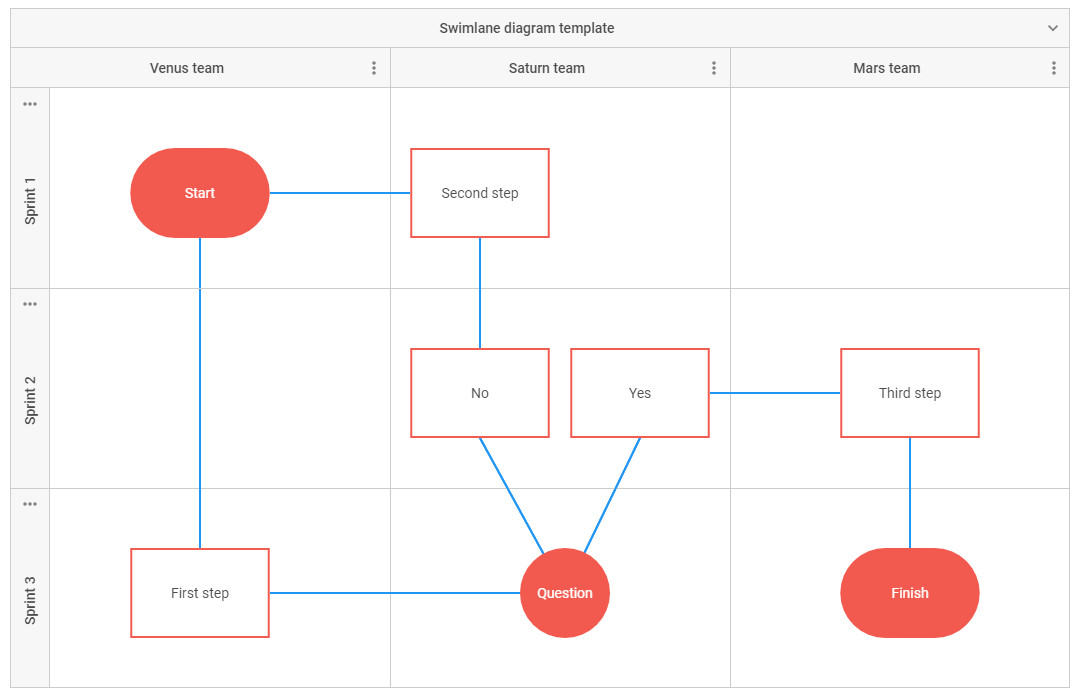 Check the code snippet >
For example, the swimlane diagram shown in the picture above has the following configuration:
"id": "main",
"type": "$swimlane",
"height": 680,
"width": 1060,
"header": {
"closable": true,
"text": "Swimlane diagram template"
},
"layout": [
[1, 2, 3],
[4, 5, 6],
[7, 8, 9]
],
"subHeaderRows": {
"headers": [
{
"text": "Sprint 1"
},
{
"text": "Sprint 2"
},
{
"text": "Sprint 3"
}
]
},
"subHeaderCols": {
"headers": [
{
"text": "Venus team"
},
{
"text": "Saturn team"
},
{
"text": "Mars team"
}
]
}
},
It has three rows and columns with six cells altogether. Its header is closable. Besides, the swimlane is equipped with subheaders for each column and row.
In addition to these options, it is possible to disable the resizing and moving of a swimlane, make a header not editable, or even implement a new configuration property following your own logic. Learn more in the documentation >
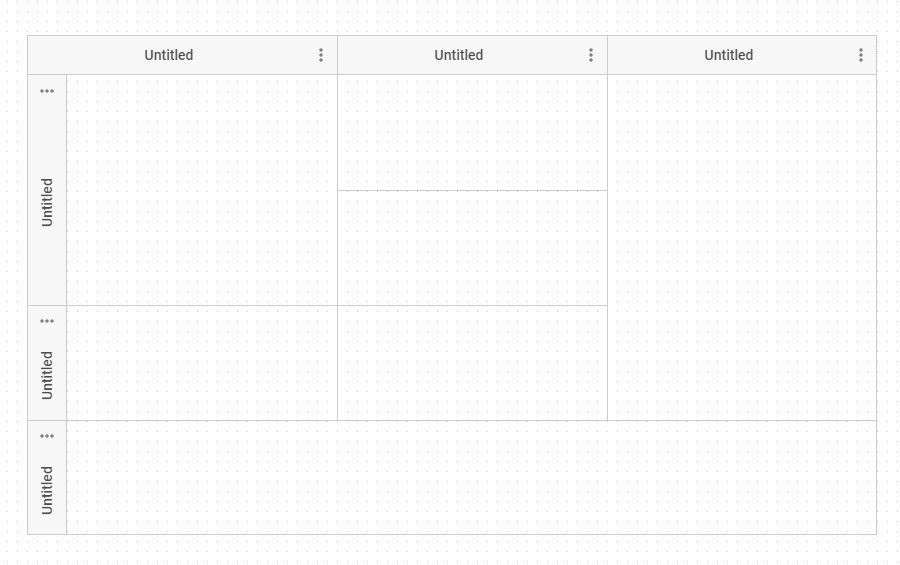
Swimlanes are extremely flexible. The layout property allows you to merge cells by removing borders between them. Thus, you can create a swimlane structure with any possible combination of cells.
The following example shows how to merge cells vertically in the first column in the first and second rows, in the third column in the first, second and third rows, and horizontally in the fourth row:
type: "$swimlane",
id: "e",
height: 500,
width: 850,
y: 2400,
layout: [
["e1", "e2", "e3"],
["e1", "e5", "e3"],
["e7", "e8", "e3"],
["e6", "e6", "e6"],
],
subHeaderRows: {
enable: true,
},
subHeaderCols: {
enable: true,
},
}
Additionally, you can redefine the configuration of particular swimlane cells. To do so, you need to create an object of the cell with the type: “$group” and id attribute and then set the desired configuration options. For example, here we redefine the background color of the cell with the value 3 of the id attribute:
// configuring a swimlane
{
type: "$swimlane",
id: "main"
height: 500,
width: 850,
layout: [
[1, 2, 3]
],
},
// configuring a swimlane cell
{
type: "$sgroup",
id: 3,
style: {
fill: "grey"
}
}
];
Manipulating Groups and Swimlanes from the UI
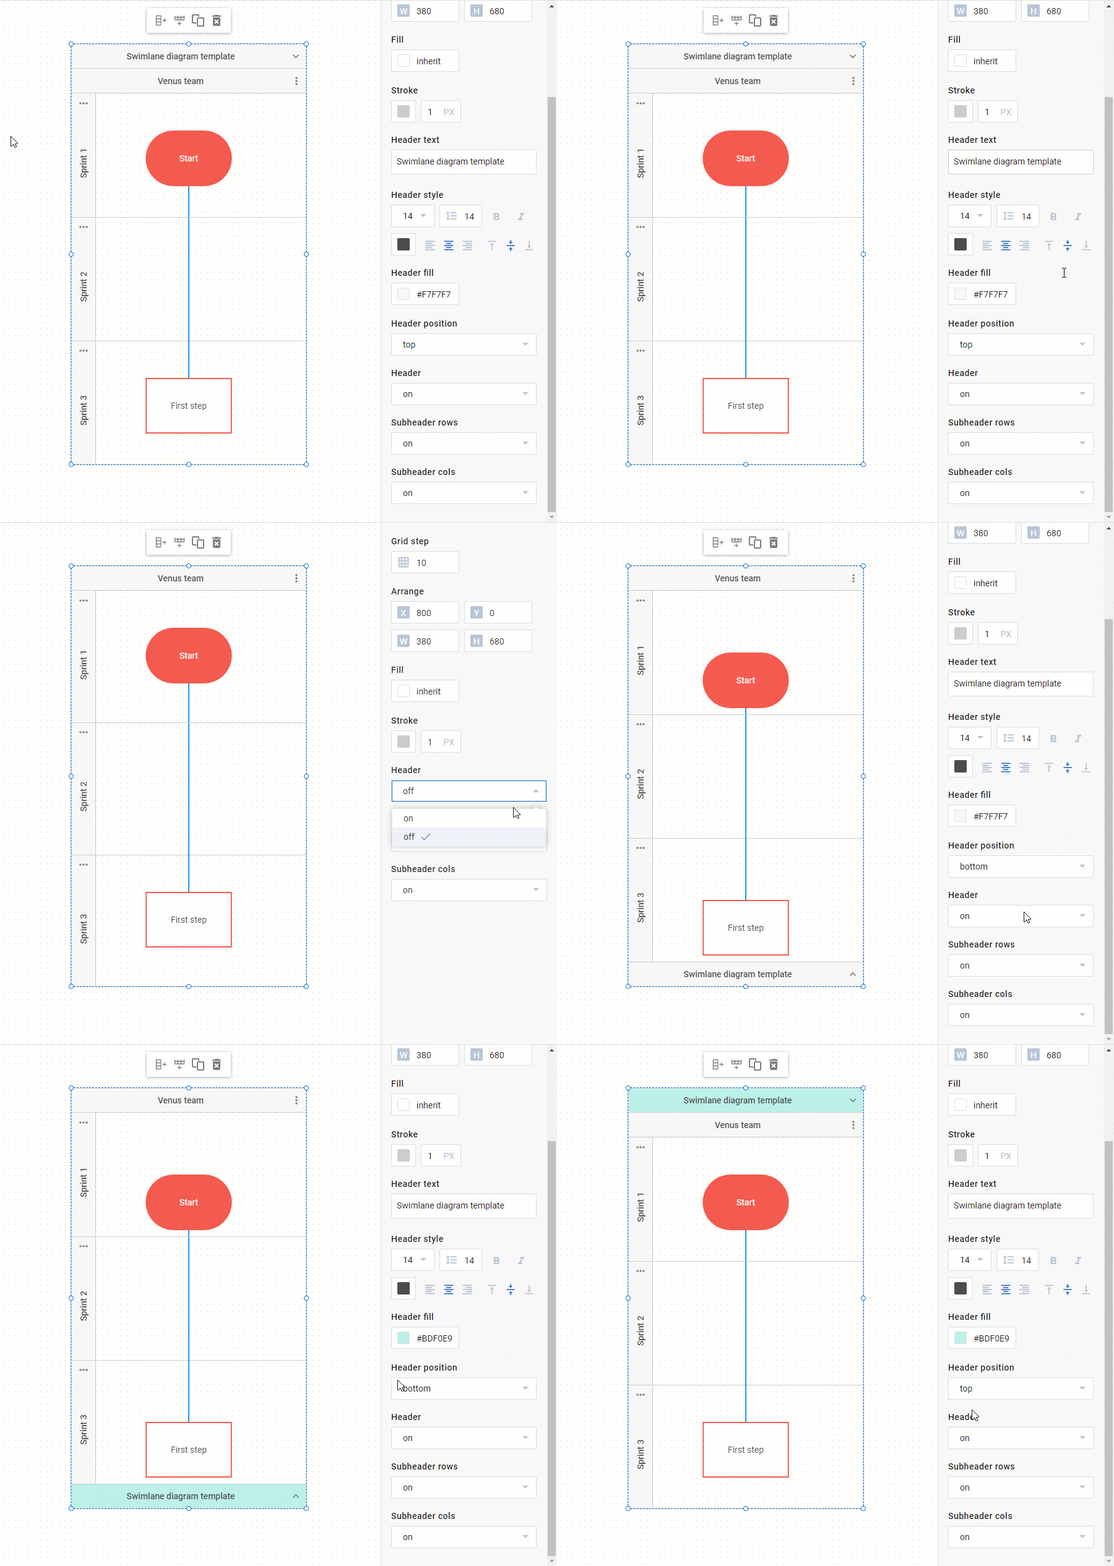
Both groups and swimlanes give you the opportunity to manage Diagram elements included in them as a whole. You can move, copy, and delete groups and swimlanes together with all their elements in the editor mode. You can also collapse a swimlane, add a new lane, move particular lanes to another position and delete any of them via a context menu.
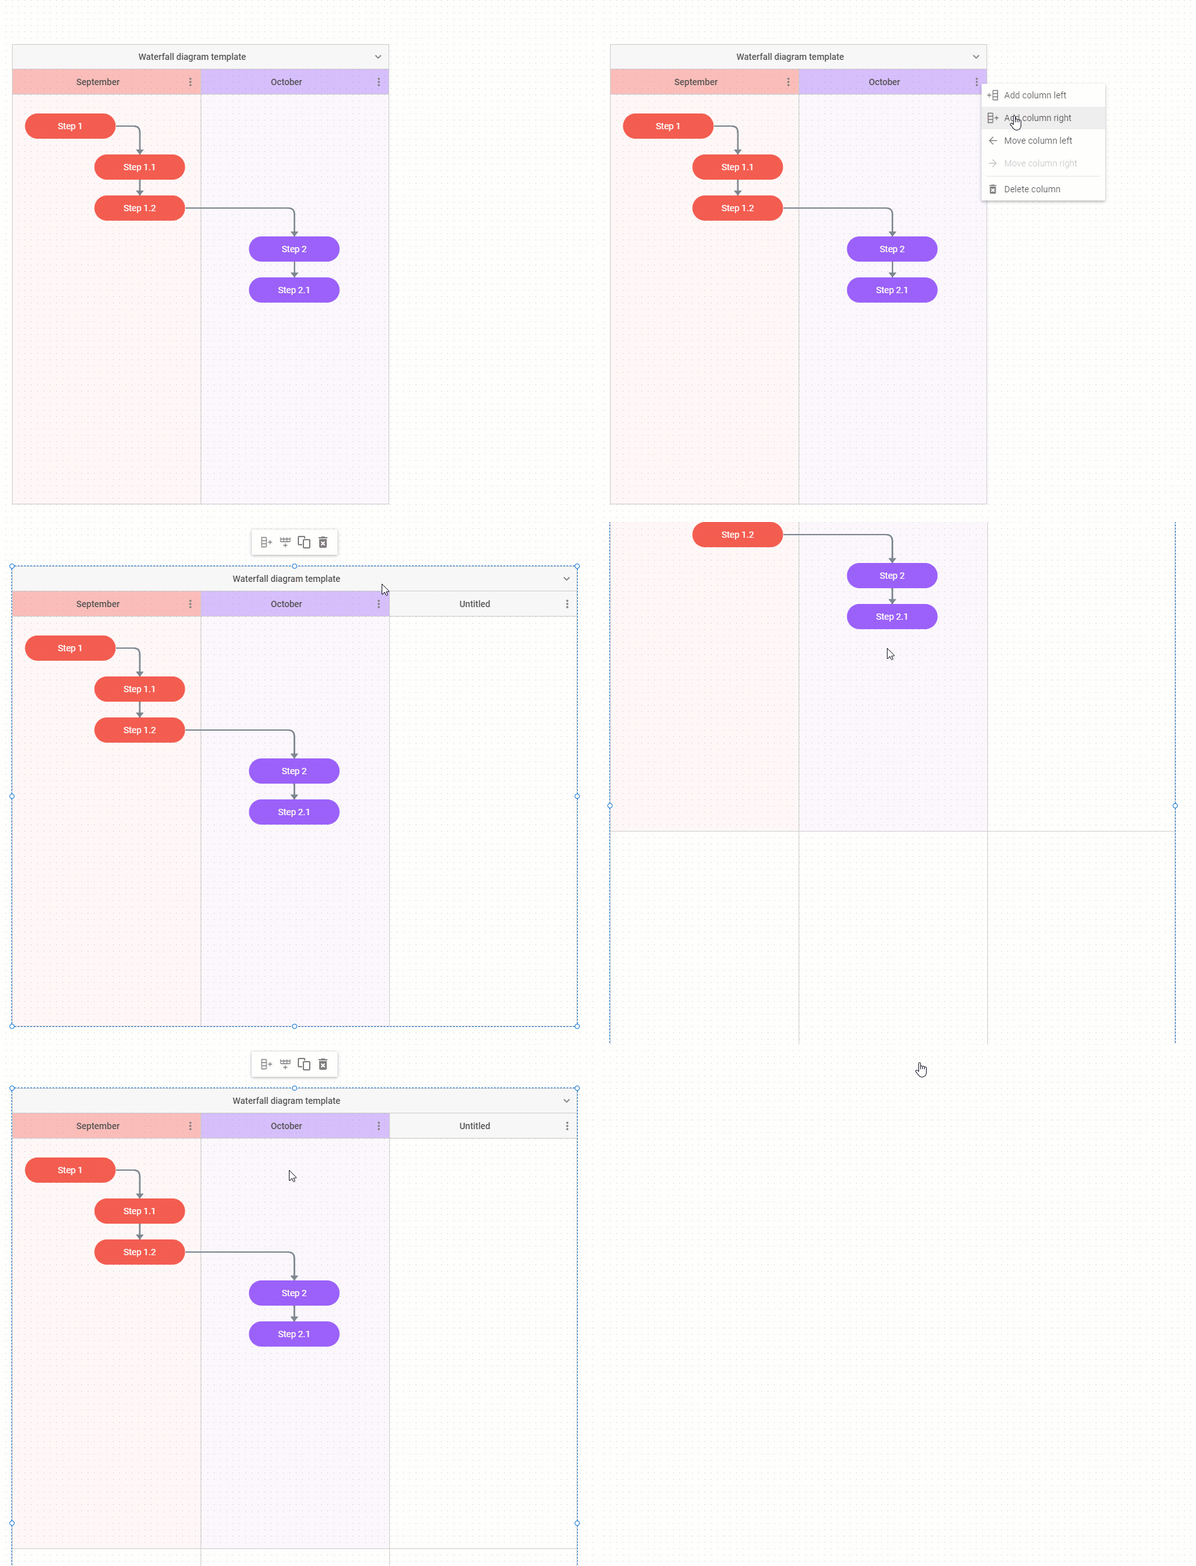 Check the code snippet >
DHTMLX Diagram editor contains sections with built-in groups and swimlanes in the left panel based on which you can build a diagram from scratch.
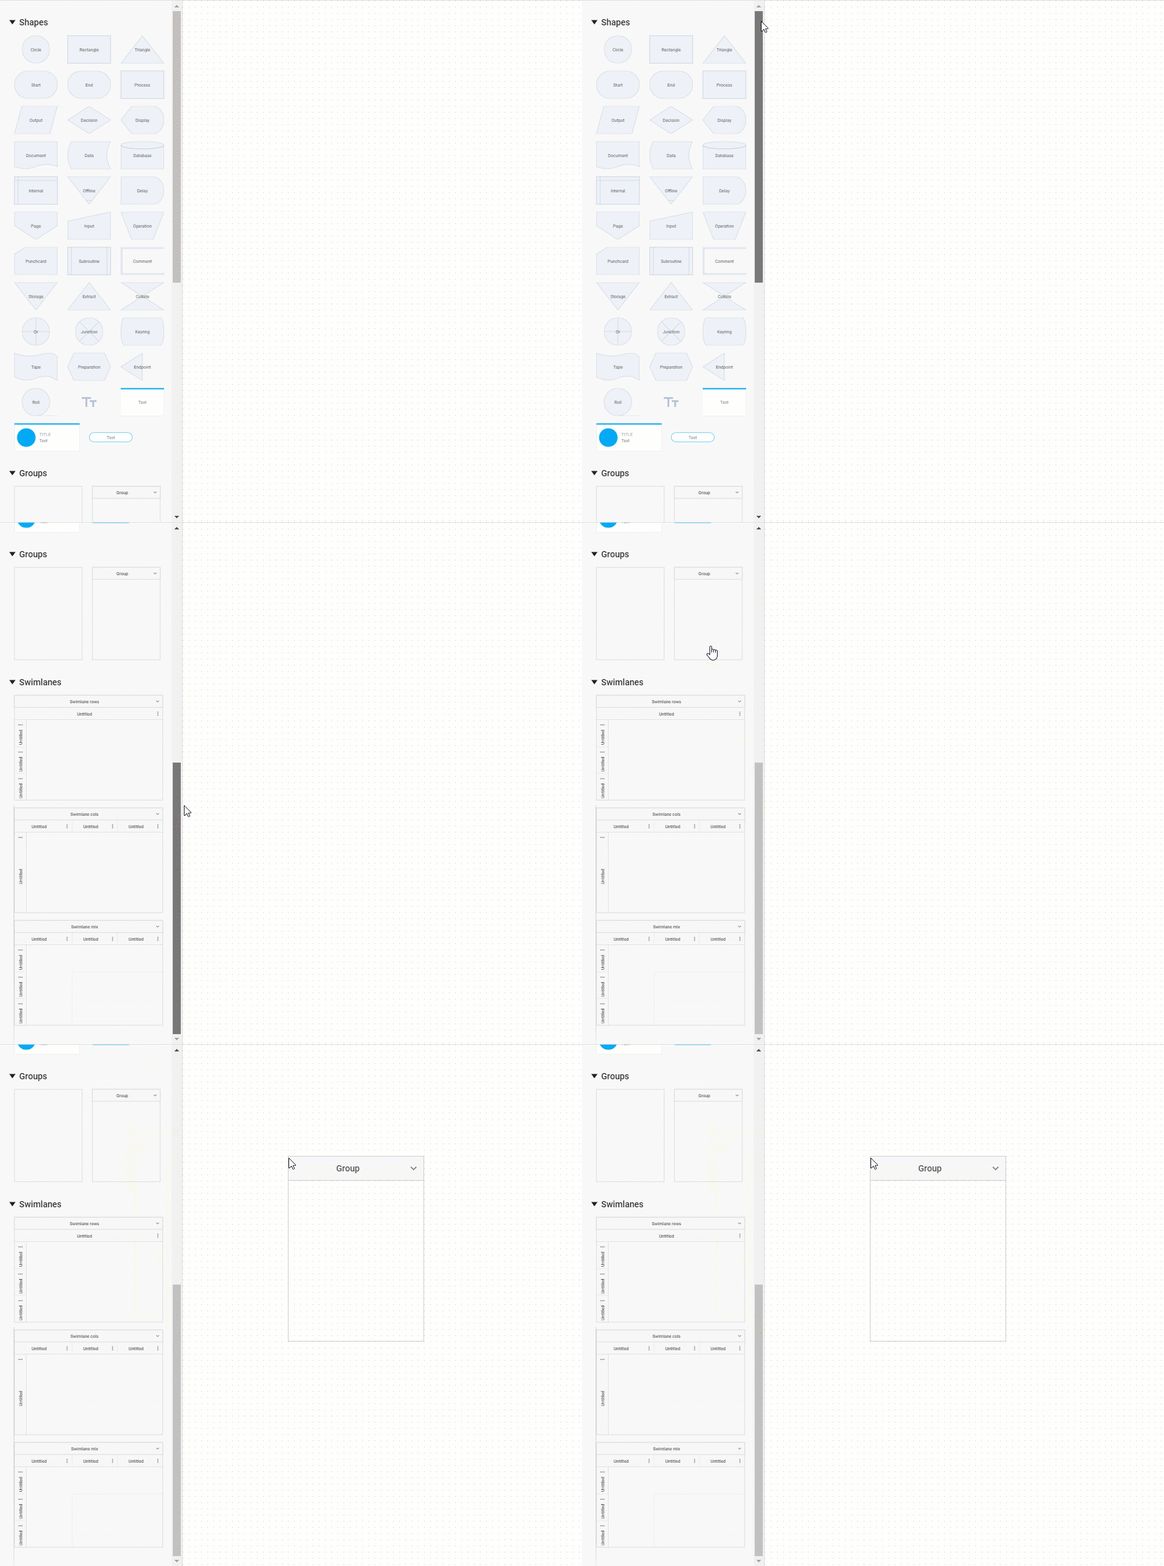
The right panel provides numerous styling options to adjust Diagram elements to your requirements, for example, change the header’s position, hide subheaders, and modify their styles.
Inline Editing
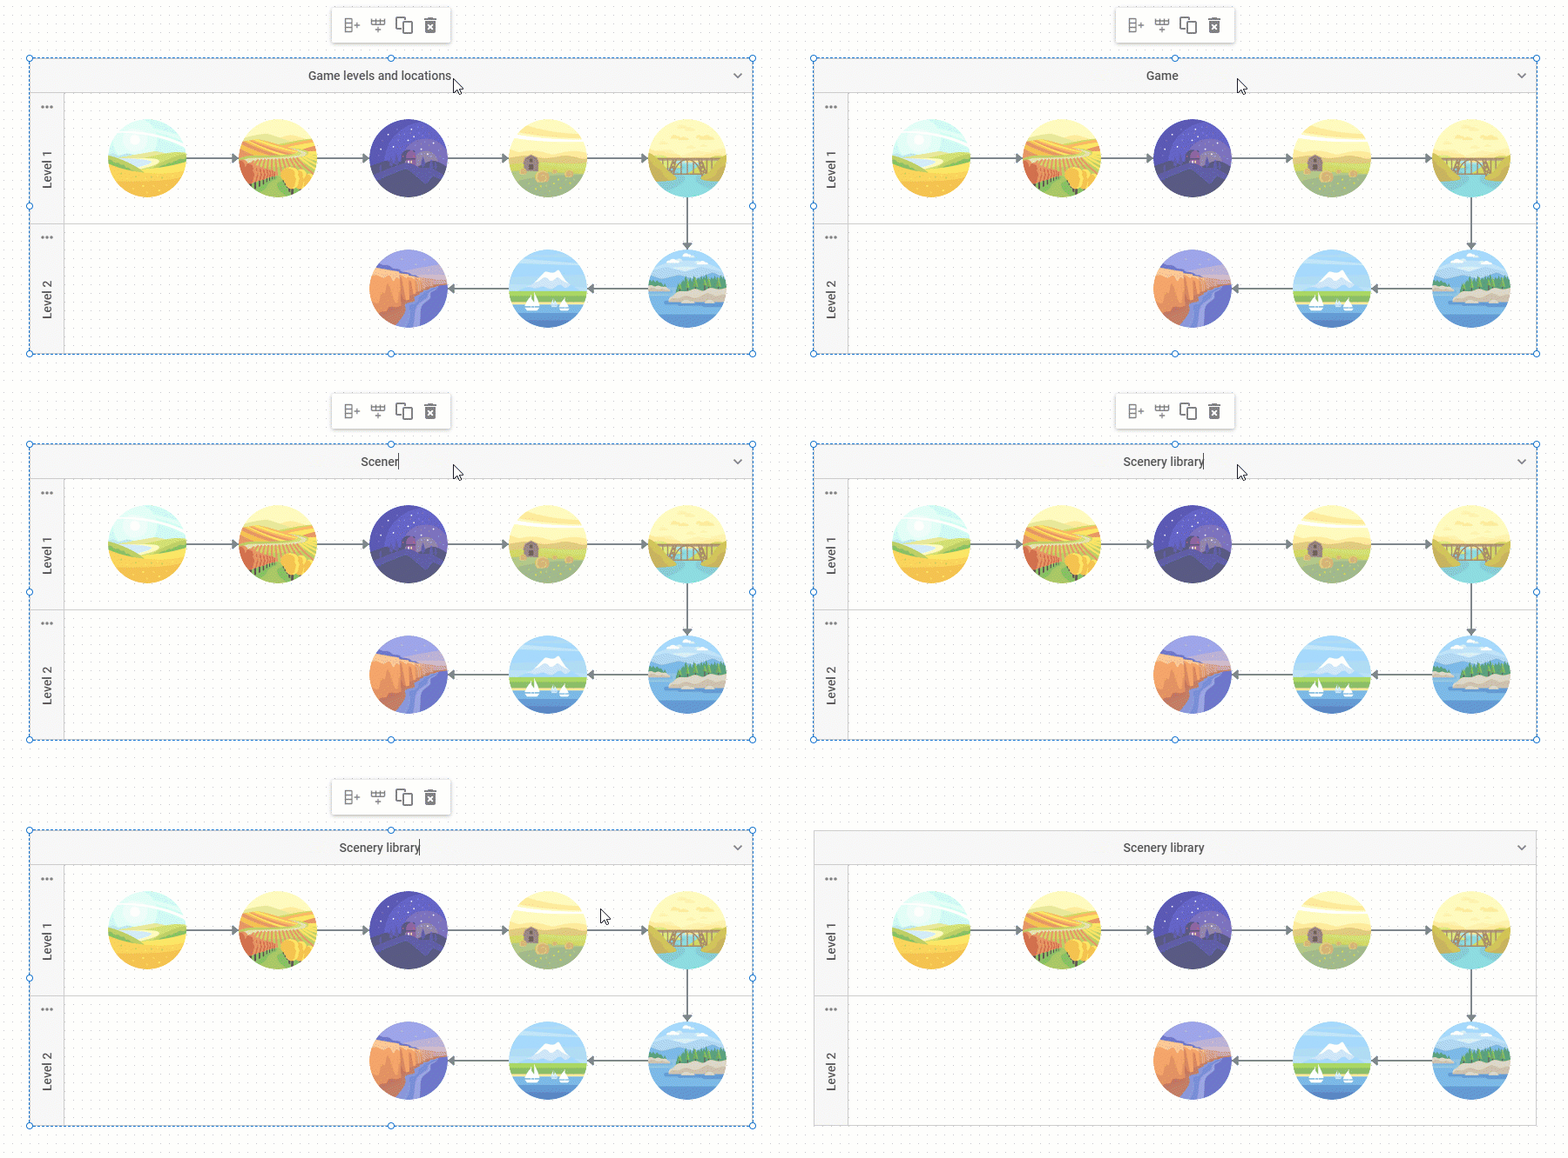
Starting with v4.0, you can benefit from inline editing and edit the text by simply double-clicking on it. Now, this feature is available in DHTMLX Diagram by default, not only in the editor mode.
Identical Elements with Different Settings in the Left Panel of the Editor
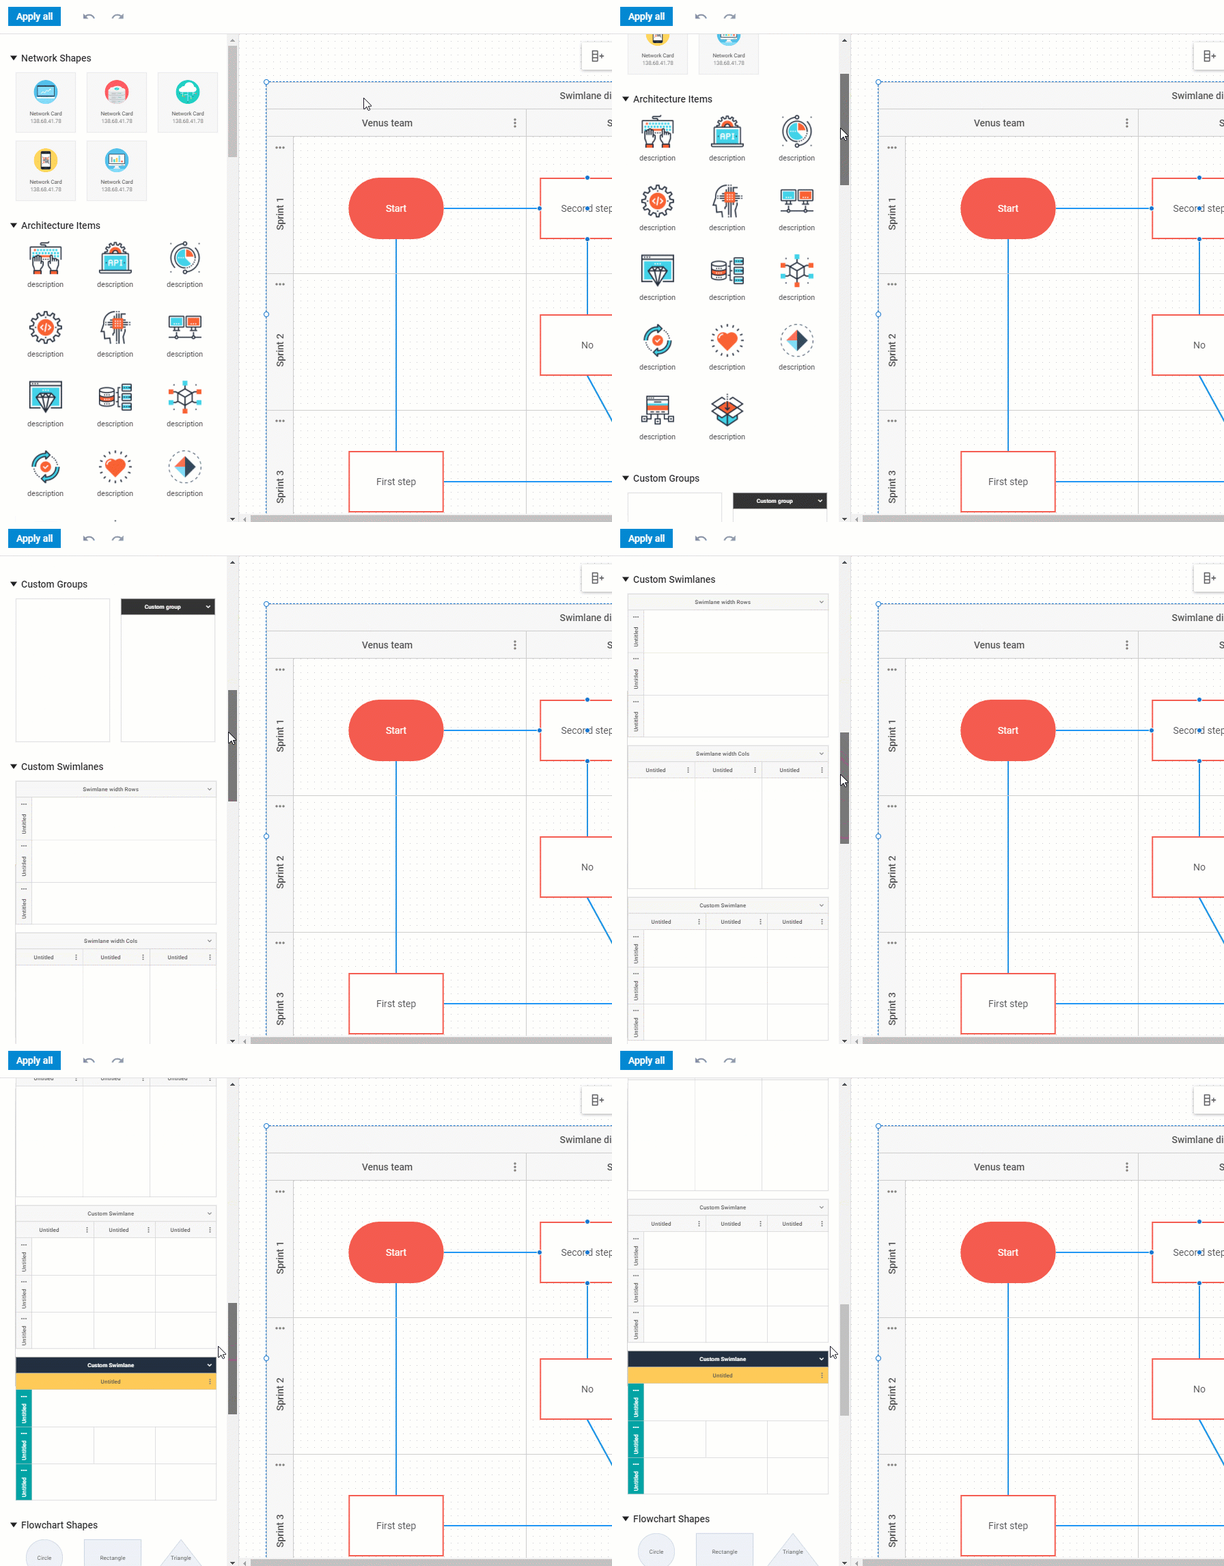
From now on, it is possible to add the same Diagram elements but with different settings to the left panel of the editor. Thus, for instance, end-users will be able to choose from similar predefined flowchart shapes differing only in color.
You can also redefine attributes of any shape and create brand new configurations of such elements as groups and swimlanes situated in the left panel. Learn more in the documentation >
DHTMLX Diagram with Angular, React, and Vue.js
In addition to all the novelties, we are glad to release demos of how to integrate the DHTMLX Diagram library with the top JavaScript frameworks: Angular, React, and Vue.js. Follow the links on GitHub, clone or download the repositories, and try out in your projects:
What’s New in the API
V4.0 empowers you to manage swimlanes programmatically with the help of the CellManager API. It provides methods for adding, moving, removing cells as rows or columns, validating cells, and much more. The CellManager API also includes new events intended to make the work with swimlanes fully interactive.
Apart from that, there appear new methods of the Shape collection: eachChild(), eachParent(), getRoot(), getRoots(). The list of events is greatly enlarged with events of the diagram and editor objects as well as with events related to the newly introduced inline editing feature.
Moreover, v4.0 introduces the editable and fixed configuration properties, which enable and disable the editing of Diagram elements.
Other Enhancements
Among other improvements, we have enhanced keyboard navigation and redesigned Diagram shapes. We have also updated the structure of the Shape Collection API and the beforeShapeMove and afterShapeMove events of the editor object. Moreover, we have extended the list of available locale options due to the introduction of groups and swimlanes. We have also considerably optimized Diagram styles.
We are looking forward to your feedback about the new DHTMLX Diagram features released in v4.0. Leave your comments below and share your thoughts with our tech support team.
Want to try out DHTMLX Diagram with swimlanes, groups, and interactive editors? Download a free 30-day evaluation version now.
We invite our existing clients to get the latest version in their Client’s Area.
Stay tuned!
