Download DHTMLX Diagram - JavaScript Diagram Library
Download Diagram
30-day free trial with official technical support
Benefits of DHTMLX Diagram:
Transform Complex Data into
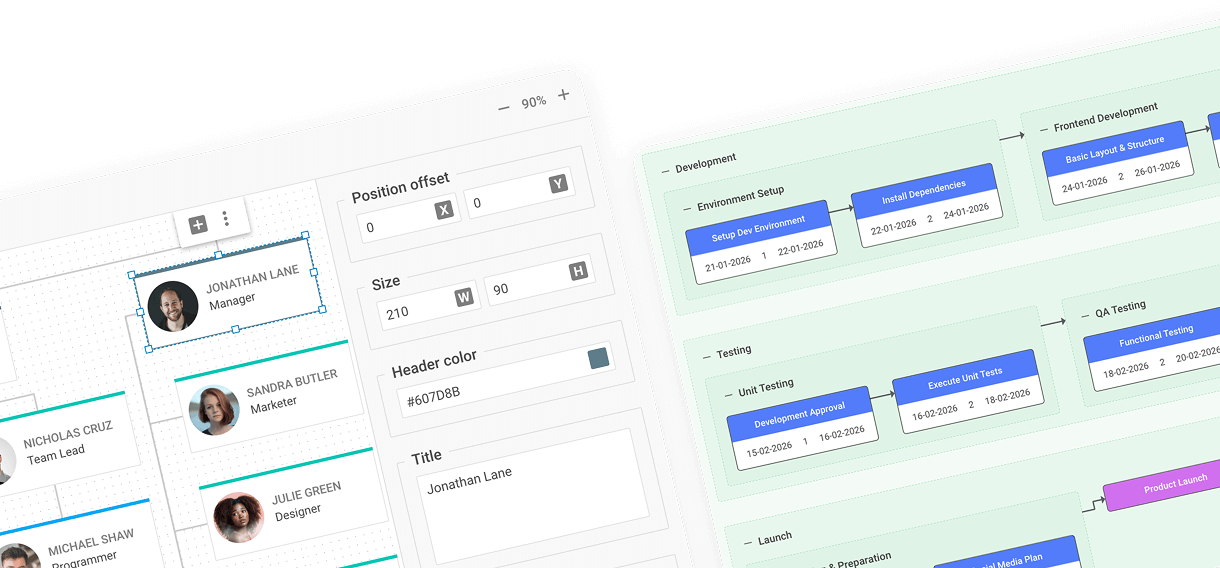
Clear Visual Diagrams with DHTMLX
DHTMLX Diagram is a versatile JavaScript library designed for building interactive diagramming interfaces in modern web apps. Its
built-in drag-and-drop editors, automatic layouts, and ready-to-use shape sets allow creating org charts, decision trees, mind maps,
and other diagrams and work with them efficiently.
built-in drag-and-drop editors, automatic layouts, and ready-to-use shape sets allow creating org charts, decision trees, mind maps,
and other diagrams and work with them efficiently.
Live Diagram, Org chart, and Mindmap editors
Built-in and custom shapes
Intuitive drag-n-drop behavior
Cross-browser support
Searching and filtering
Export to PDF and PNG
Orthogonal and Radial auto layouts
Creating swimlanes and groups
Inline editing
Touch support
Keyboard navigation

Explore Other DHTMLX Free Trials
Combining DHTMLX Diagram with other components enables you to build a complete data visualization and management system with a smooth UI and synchronized data. All DHTMLX components are designed for seamless integration, reducing development time and ensuring reliable interoperability.
Gantt
Create and edit Gantt charts for project management.

Grid
Build dynamic data grids to organize and edit large datasets.

RichText
Enhance your web app with a user-friendly WYSIWYG text editor.

Spreadsheet
Deliver Excel-style functionality with a responsive spreadsheet.

Documentation
Explore the documentation
Discover detailed API references, step-by-step guides, and integration tutorials to help you quickly set up, configure, and customize the Diagram component.
Community forum
Connect with the community
Join our active community forum filled with shared insights, answers from our tech team, and discussions about using DHTMLX Diagram.
Official tech support
Get technical support
Learn about the available support options for trial users, commercial license owners, and developers working with DHTMLX Diagram.