Lovable makes it surprisingly easy to scaffold a modern application using a single prompt, positioning itself as a next-generation tool for rapid AI-assisted frontend development. In just a few minutes, you can get a working admin app with routing, layout, and styling already in place.
A detailed overview of Lovable’s core ideas and workflow is available in the official documentation.
Lovable copes well with standard layouts and common UI patterns. However, AI-generated scaffolds usually stop at generic UI components. As soon as you need something more advanced, such as a project planning software with a built-in Gantt chart, you have to take control of the codebase yourself.
In this tutorial, we’ll start with an admin app generated by Lovable and extend it with the DHTMLX React Gantt (trial version). The expected result is a real project planning dashboard that works both locally and in Lovable’s preview.
What We’re Building
By the end of this tutorial, you’ll have:
- an admin app generated by Lovable AI,
- a GitHub repository fully synced with Lovable,
- a locally runnable React + Vite project,
- DHTMLX React Gantt (trial) embedded into the dashboard layout.
Prerequisites
Before starting, make sure you have:
- a Lovable account,
- a GitHub account,
- Node.js 18 or newer,
- npm is installed locally.
If you’re new to Lovable or something in the UI looks different, the official documentation includes a built-in AI assistant that can help clarify platform-specific questions.
1. Generating the Admin App with Lovable AI
Before getting started, it’s worth noting that Lovable offers a free plan with daily and monthly prompt limits, which is sufficient for completing this tutorial.
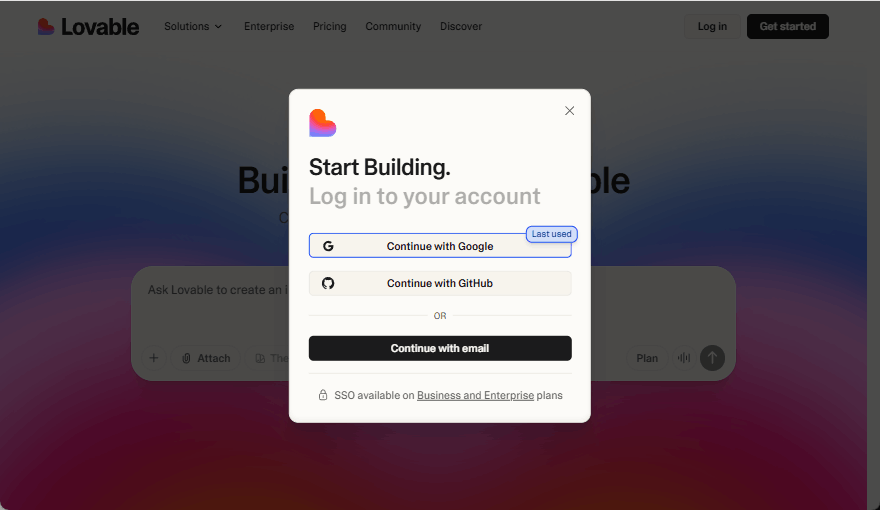
Start by opening Lovable in your browser.
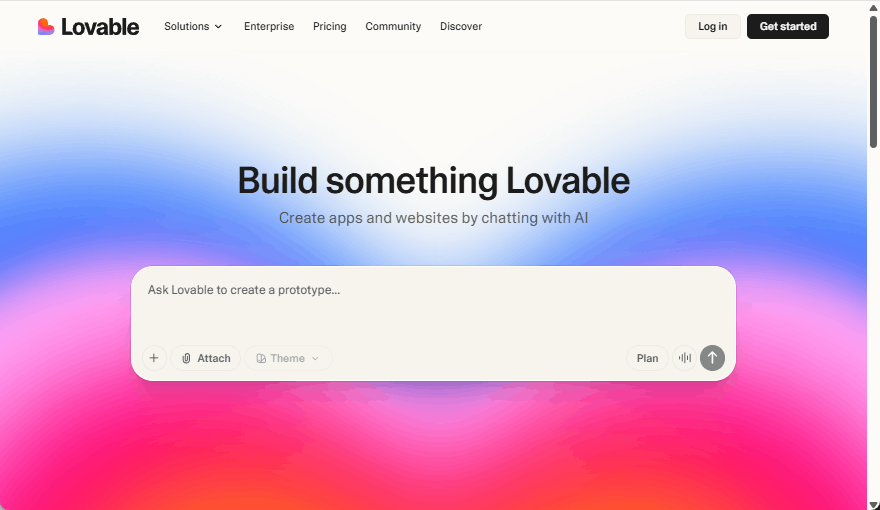
Log in using your preferred method (Google, GitHub, or email).
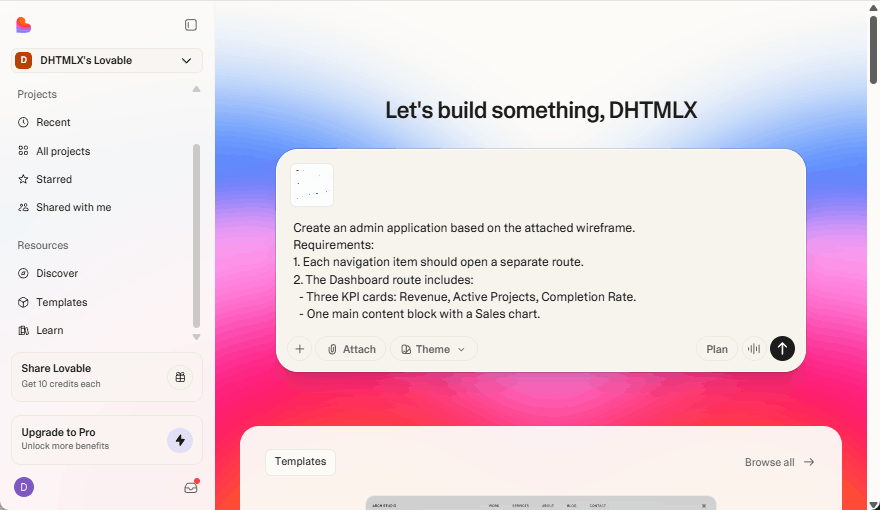
After logging in, you’ll see the project creation input.
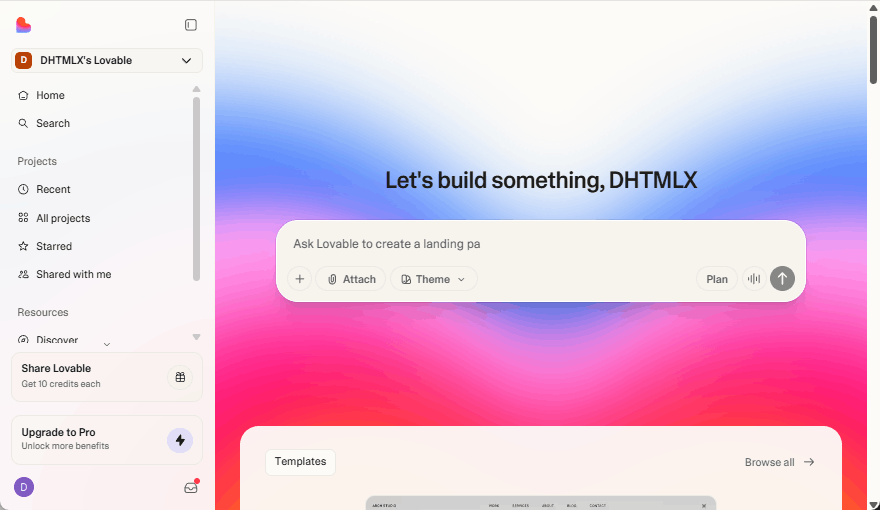
This is where you input the prompt with the description of the app that Lovable should generate.
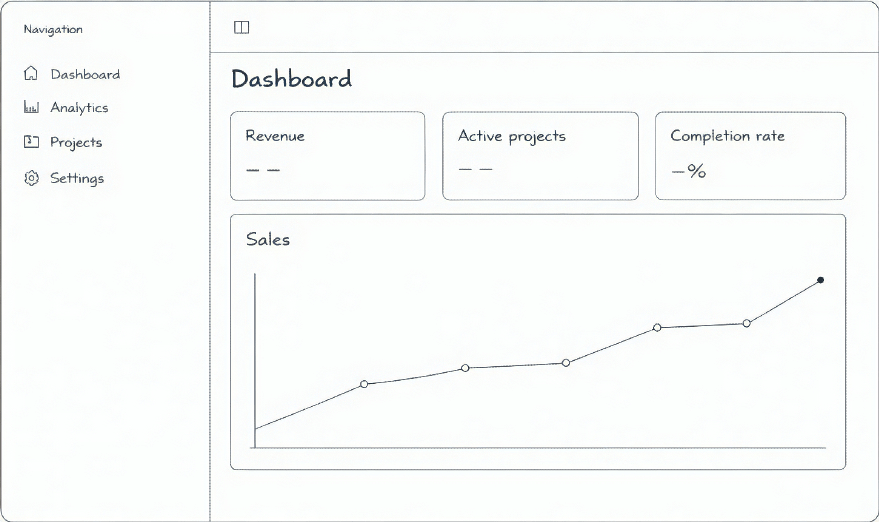
Lovable can generate applications using both a wireframe and a text prompt. We’ll use a wireframe together with written instructions.
Attach the wireframe using the Attach button below the prompt input:
Then submit the following prompt #1:
“Create an admin application based on the attached wireframe.
Requirements:
1. Each navigation item should open a separate route.
2. The Dashboard route includes:
– Three KPI cards: Revenue, Active Projects, Completion Rate.
– One main content block with a Sales chart.”
Lovable will generate the project and open a live preview.
2. Reviewing the Generated Application
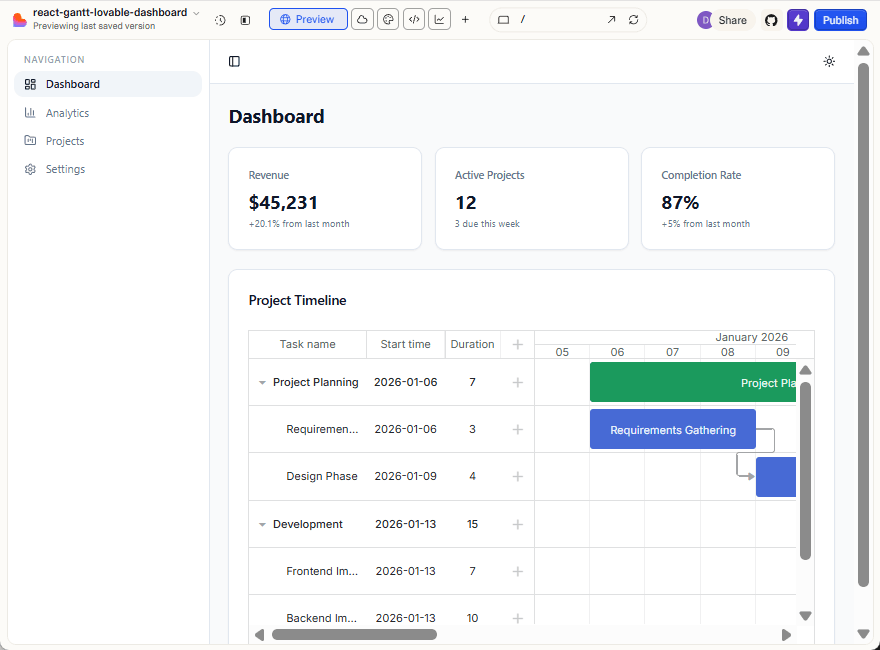
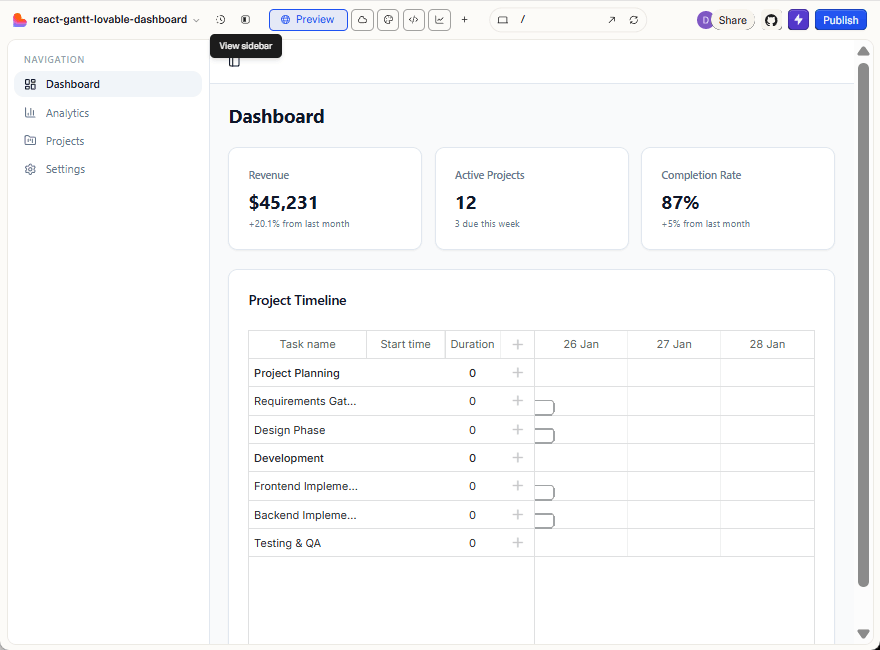
At this point, Lovable has created an admin dashboard React application:
- a collapsible sidebar with multiple routes
- a dashboard page with cards and a chart
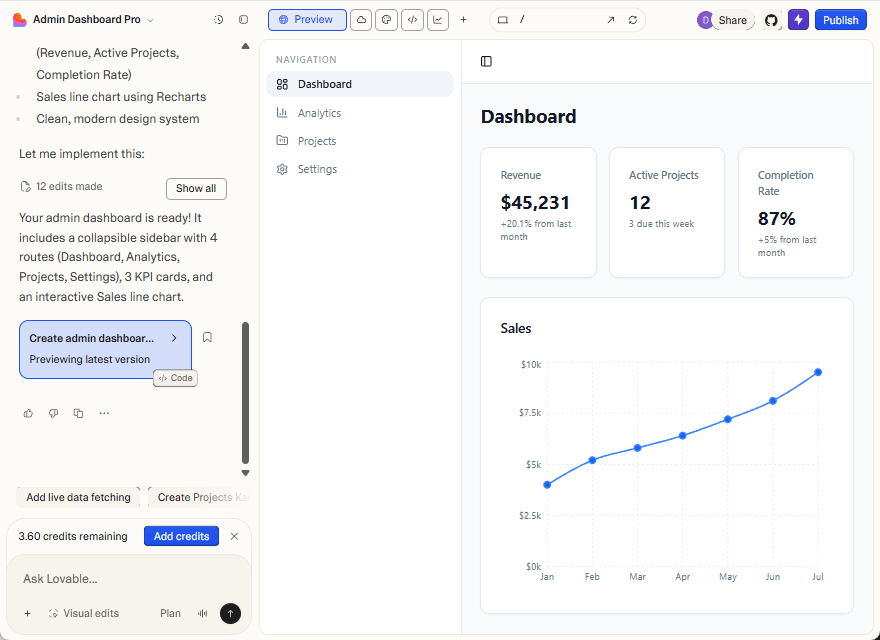
This gives us a solid foundation and demonstrates how the AI+React workflow speeds up the development of modern UIs. Next, you’ll connect the project to GitHub.
3. Connecting the Project to GitHub
To work on the project locally, you need to connect it to GitHub.
Click on the GitHub icon at the top right of the view.
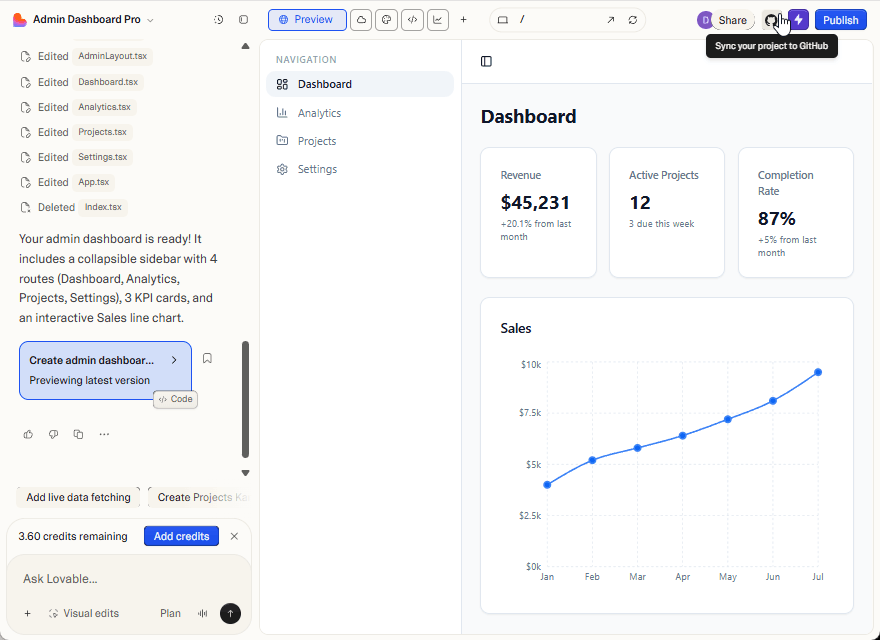
When prompted, connect Lovable to your GitHub account and authorize access.
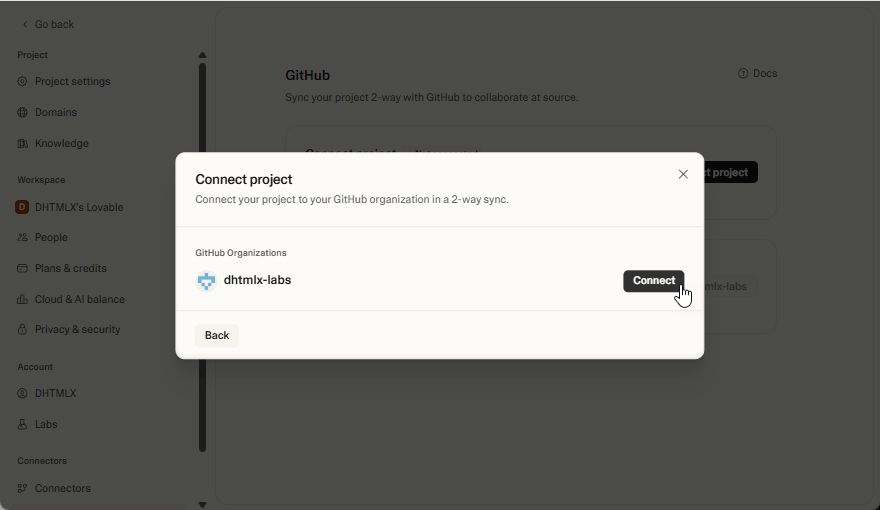
Confirm the repository transfer. Lovable will create a GitHub repository and keep it in sync.
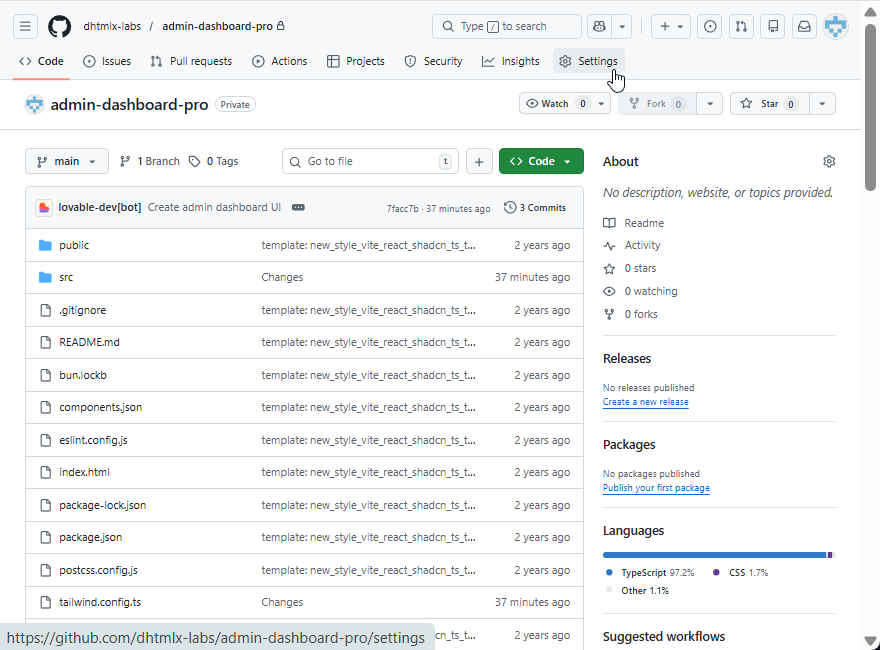
Open the repository in GitHub and verify that the files were transferred successfully.
You can rename the project and repository in the GitHub repository settings.
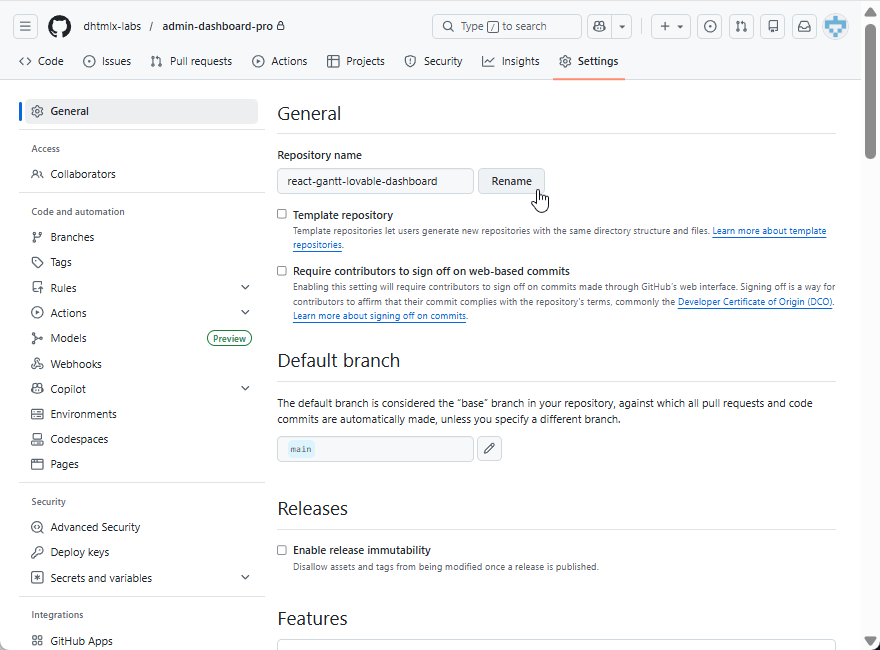
The name will be automatically updated in Lovable.
4. Adding DHTMLX React Gantt Component (Trial Version)
For this React Gantt chart integration guide, you can use the trial version of DHTMLX React Gantt installed directly from the public npm.
Submit the following prompt #2:
“Replace the Sales chart with a DHTMLX React Gantt chart using @dhtmlx/trial-react-gantt.”
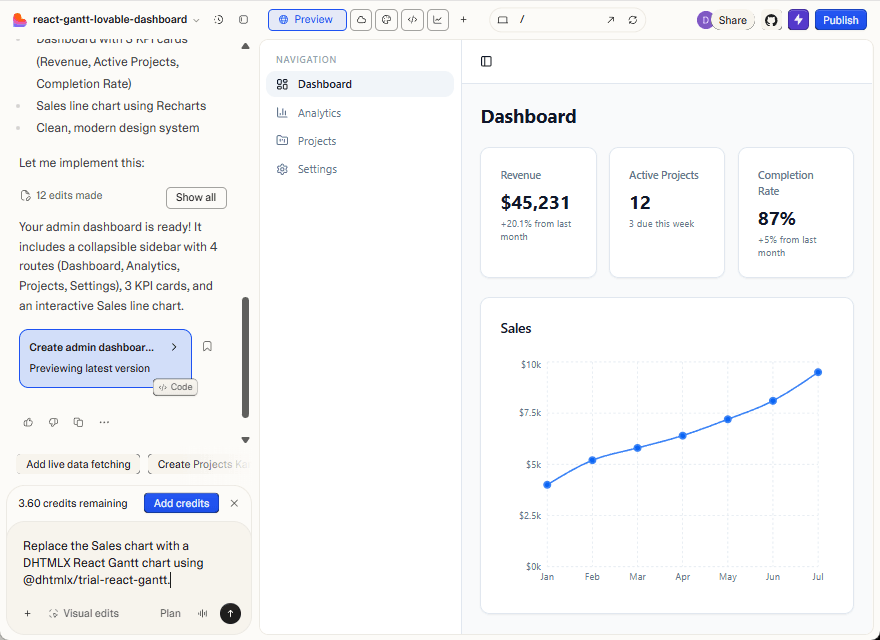
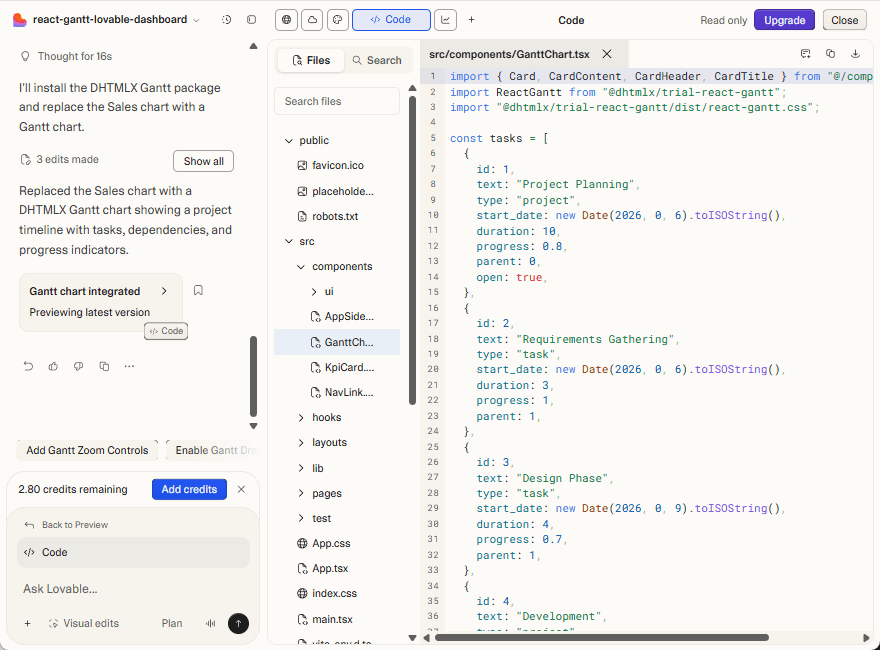
Lovable will update the project, install the required package, and replace the existing Sales chart with a Gantt chart.
However, while the component is rendered, the result is clearly incomplete: the timeline appears, but the tasks are missing.
Unlike mass-adopted frameworks such as React itself, domain-specific components don’t always have enough high-quality public signals for the model to infer correct usage details. As a result, the generated code may look structurally correct and even align with parts of the official documentation, but still fail at runtime, requiring manual inspection and fixes.
At this stage, it’s clear that the integration requires closer inspection.
Lovable allows you to review the generated source code directly in the editor, which helps you understand how the Gantt component was integrated and how the data is passed to it:
For more involved issues, it is often more convenient to work with the code locally.
5. Cloning and Running the Project Locally
To continue, clone the generated repository to your local machine:
cd <your-repo>
Install dependencies and start the development server:
npm run dev
Open the local URL shown in the terminal (usually http://localhost:8080). When the application runs locally, the page does not render and appears blank. The browser’s developer tools panel shows multiple runtime errors in the console.
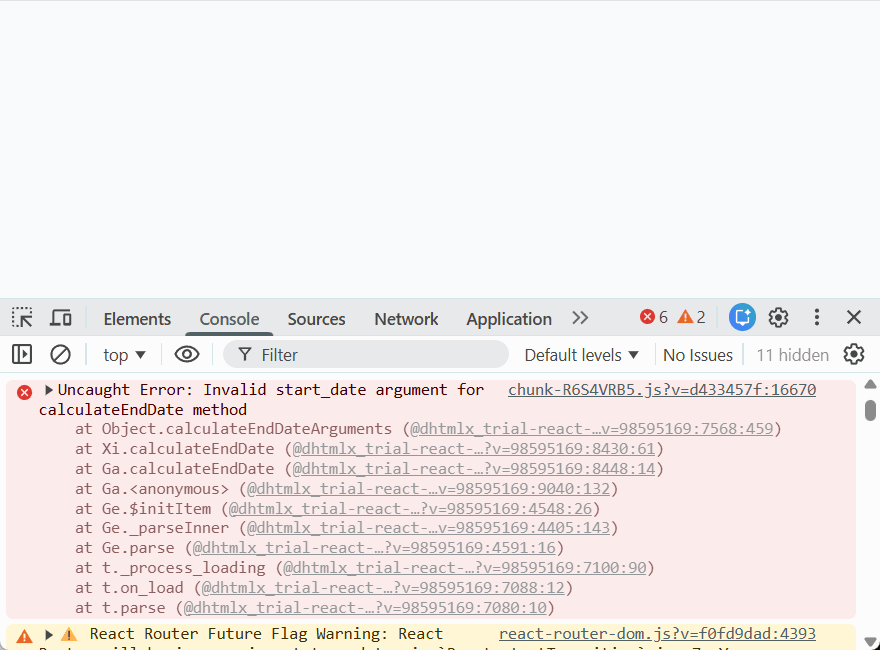
It looks like Lovable used an incorrect date format for the start_date field. When examining the generated code, you can see how the task data was defined:
id: 1,
text: "Project Planning",
type: "project",
start_date: new Date(2026, 0, 6).toISOString(),
duration: 10,
progress: 0.8,
parent: 0,
open: true,
}
Here, start_date is provided as an ISO string. However, the Gantt component expects a Date value (or a string format explicitly configured via dateFormat). Because of this mismatch, Gantt fails during initialization, and the application does not render correctly. To move forward, you can apply a quick local fix and check whether it resolves the issue. You simply remove .toISOString() in all task objects and pass Date instances directly:
{
id: 1,
text: "Project Planning",
type: "project",
start_date: new Date(2026, 0, 6),
duration: 10,
progress: 0.8,
parent: 0,
open: true,
},
…
]
After this change, the Gantt chart renders as expected.
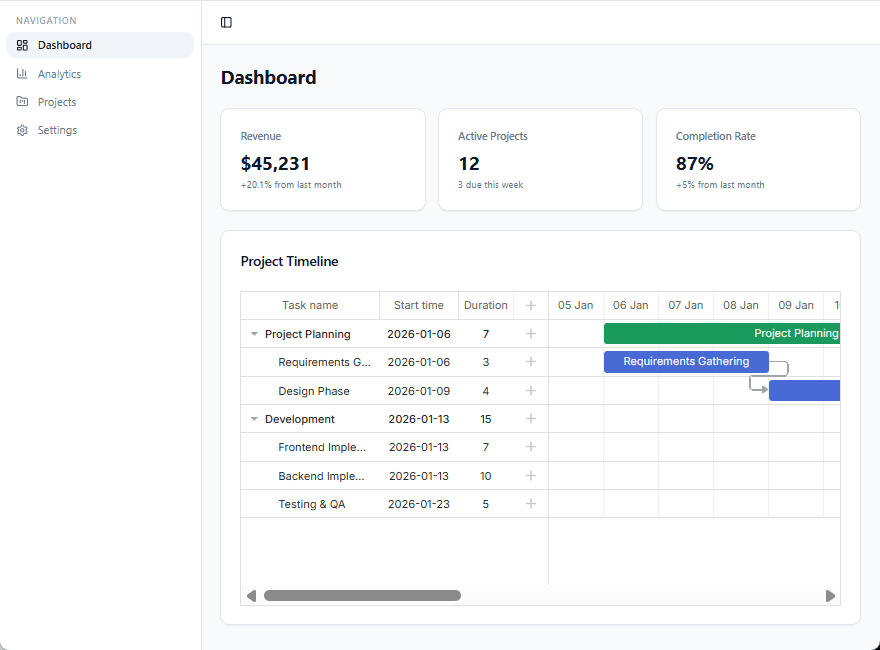
This fix solves the immediate problem, but it doesn’t address the underlying cause. The issue here wasn’t a complex bug or a missing dependency. Lovable simply didn’t have enough accurate context about how DHTMLX Gantt expects its data to be structured. As a result, it made a reasonable assumption that turned out to be wrong.
Final Words
All in all, you’ve seen in practice that Lovable AI is capable of creating a working admin app after being provided with relevant instructions in a prompt. Also, you’ve learned how to add the project to GitHub, extend its functionality with a Gantt chart, run the app locally, and deal with runtime issues. But most importantly, you’ve come across a challenging aspect of AI-powered development, which lies in the correct use of specialized UI components without additional context.
Here comes the question: How can you help an AI app builder like Lovable work with a specialized library more reliably?
There are three ways to provide an LLM with additional context about a third-party API. We elaborate on these options in Part 2 of the tutorial.