When having conversations with our current customers, we often ask them what they would like to see in a new version of our products. They often do not have a ready answer to this question, especially regarding popular and mature components like DHTMLX Gantt. In such cases, they hardly need to see drastic changes in the tool that already works well, but rather targeted refinements focused on enhanced usability, flexibility, and developer convenience. That’s what the new DHTMLX Gantt 9.1 is all about.
The new Gantt version brings along timescale optimizations, better control over the rendering of split tasks, enhanced real-time collaboration, new lightbox control for resource assignment, and much more.
These features are now available both in the JavaScript Gantt chart and its React Gantt version.
Let’s go through the Gantt novelties in more detail.
Workhour-Aware Scale Projection
In DHTMLX Gantt, the default timescale is based on days, and each day in the timeline covers a 24-hour span (00:00-24:00). But in real-case scenarios, one working day usually lasts 8 hours (e.g. 09:00-17:00). So, if you add a task that takes the whole working day to finish, it will fill only one-third of the 24-hour day cell. It may seem confusing, as if the task takes much less time to be completed than specified in the grid panel.
 Check the sample >
The new workhour-aware scale projection (projection mode) helps eliminate this visual mismatch. From now on, the length of task bars in the timeline depends on working hours rather than absolute time. In other words, a task that takes the full working day (8 hours) will fill the whole day cell. A task with a shorter duration/timeframe will appear proportionally shorter within a given cell.
Since working hours may vary between employees or departments (4 or 6 hours instead of the common 8 hours), the new feature will help adjust taskbar lengths to reflect the actual working time.
The scale projection feature is applied to the bottom-most scale (Day or Week). To do that, you need to add the projection property to the corresponding scale object:
{ unit: "month", step: 1, format: "%M %Y" },
{ unit: "week", step: 1, format: date => {
const to = gantt.date.add(date, 7 - date.getDay(), "day");
const format = gantt.date.date_to_str("%d %M");
return `${format(date)} - ${format(to)}`;
}},
{ unit: "day", step: 1, format: "%d", projection: { source: "fixedHours" } }
];
Technically speaking, there are three projection modes for displaying working hours in timeline cells:
- Default mode – the absolute time (00:00-24:00) to indicate working hours for tasks on the timeline.
- Fixed hours mode – fixed working hours for all tasks on the timeline (taken from global working time settings in Gantt)
{ unit: “day”, step: 1, format: “%d”, projection: { source: “fixedHours” }
];
Here is how working hours can be set manually:
{ unit: “day”, step: 1, format: “%d”, projection: { source: “fixedHours”, hours: “09:00-18:00” }
];
- Task calendar mode – working hours for each day (cell) are calculated with the use of task calendars. If a cell has no work time, the default mode is applied.
After specifying the new setting for a particular task (e.g., 9.00-17.00 on Monday), it will persist when dragging or resizing this task. For instance, if you decide that this task should take not one but two days and resize the task, the taskbar will remain aligned with the set working hours on both days (9.00-17.00, not full days). At the same time, the scheduling logic for a task (start and end time) still depends on the worktime calendar applied for this task.
As a result, this novelty makes the timeline visualization match the real working schedule, which is especially useful when not all tasks follow the same daily schedule.
And don’t forget that this feature is working only for Day and Week scales, while other scale formats stick to absolute time.
Fixed Column Width for the Time Scale
Normally, the width of the Gantt timeline cells automatically stretches to fit the size of the chart container or shrinks to the minimum allowed width (min_column_width) when horizontal scrolling appears. But what if you need the Gantt timeline with a fixed column width for the time scale? From now on, you can set a specific length for columns (e.g, 60 px) using the newly added column_width setting:
{ unit: "month", step: 1, format: "%F, %Y" },
{ unit: "day", step: 1, format: "%j, %D", column_width: 60 }
];
In the example above, first, you see the Gantt timeline with automatically adjusted column width, then it shows how the new column_width setting works in practice.
This novelty is applied only to the bottom scale. If not enabled, the default behavior persists.
Per-Child Placement for Split Subtasks
In Gantt, split tasks are represented as subtasks of a parent task. By default, the parent bar is collapsed, and split subtasks are rendered on the parent’s row. When expanded, split subtasks will render in separate subrows. From now on, you can control how each subtask renders on the timeline.
For this purpose, you’ll need the new split_placement property of the task object, allowing you to specify the required mode depending on the state of the parent row:
- “split_placement”: “inline” – subtasks are always displayed on the parent’s row.
- “split_placement”: “subrow” – subtasks are displayed in separate subrows, same way as regular tasks. If the parent is collapsed, the subtask is not visible.
- “split_placement”: “auto” (default behavior) – split subtasks are displayed on the parent’s row when the parent item is collapsed and in subrows when the parent is expanded.
{ id: 12, text: "Video Editing", parent: 10, start_date: "08-04-2025", duration: 10, split_placement: "subrow" }
{ id: 13, text: "Copywriting", parent: 10, start_date: "04-04-2025", duration: 7 } // auto
This gives you fine-grained control over dense timelines while keeping defaults convenient.
Multi-User Live Updates & External Change Hooks
In modern project management solutions, collaborative editing becomes a necessity. Therefore, after being successfully battle-tested in Scheduler and Kanban components, this feature now comes to Gantt. To synchronize changes among multiple users in real time, we enriched the Gantt API with the new remoteEvents helper.
Here is how it works under the hood:
- The remoteEvents helper establishes a connection between the Gantt chart and a compatible backend via WebSocket.
- The DataProcessor sends any changes (e.g., adding or moving a task) via REST API.
- The server then broadcasts all changes to users, keeping everyone’s Gantt chart in sync.
Additionally, you can use this approach to receive updates from external data sources in real time (e.g., from Firebase). For more information, refer to the Live Updates guide in the documentation.
This GitHub example shows how to use the new functionality for connecting DHTMLX Gantt to the Firestore backend.
New Lightbox Control for Resource Assignments
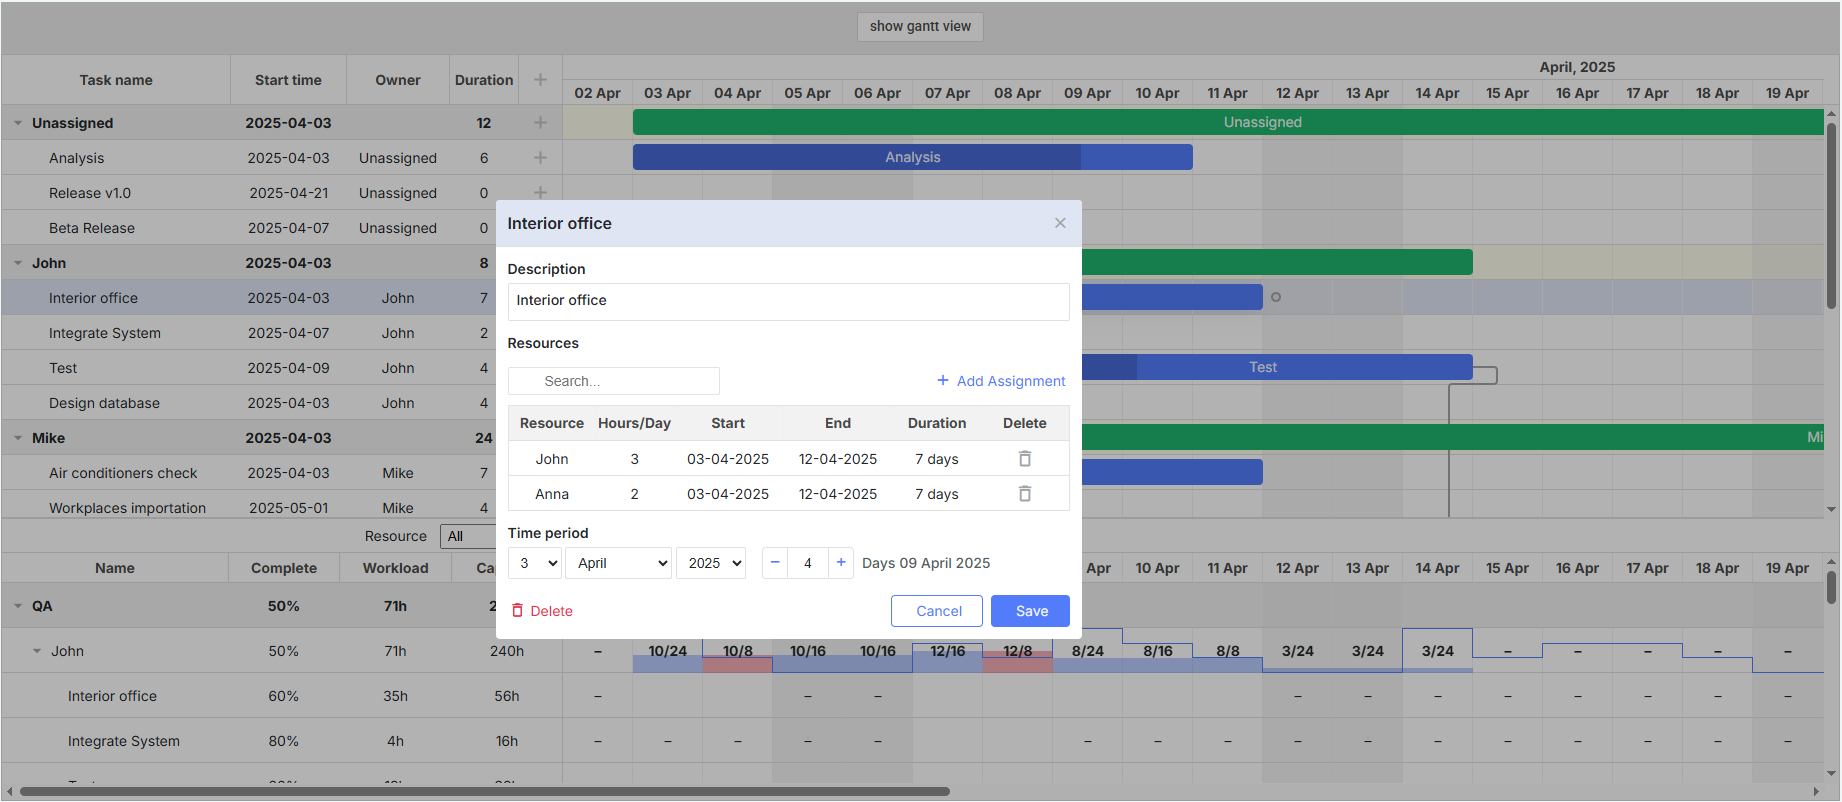
The updated Gantt also touches on another important aspect of project management, such as resource allocation. In v9.1, we added a more functional resource assignment control to the lightbox. The new control allows specifying multiple uses of resources (employees, equipment, etc.) within a single task.
Technically, it uses the same Grid module that is utilized by the left-hand panel of our Gantt and accepts the same configuration and templates. Therefore, you can customize columns displayed in the assignments list and make columns editable via inline editors.
As a result, you can not only style the assignments list as desired, but also enable end-users to easily adjust the duration and mode of assignments so they can create partial assignments where a resource is allocated only to certain dates within the task. For instance, there is a task that takes 7 days, so you can assign John to work on this task for the first two days, while Anna can be added to complete it.
 Check the sample >
{ name: "description", height: 38, type: "textarea", map_to: "text", focus: true },
{ name: "time", type: "duration", map_to: "auto" },
{ name: "assignments", type: "resourcePeriods", map_to: "assignments", height: 120 }
];
Thus, it becomes easier to handle partial allocations, replacements, and handovers both for developers (when configuring) and end-users (when editing assignments).
Updated Calendar Configuration
Previously, when you wanted to define a working calendar in DHTMLX Gantt, first, you had to create the calendar, then set working times. From now on, you can use the updated gantt.addCalendar() method to define default working hours for weekdays, specific dates (day off, shortened working day, etc.), and custom weeks in one config.
id: "myCalendar",
hours: ["8:00-12:00", "13:00-17:00"], // global work hours for weekdays
days: {
weekdays: [0, 1, 1, 1, 1, 1, 0], // working week days from Sunday to Monday
dates: {
"2025-04-06": true, // override work hours for a specific date
"2025-04-08": false,
"2025-04-09": ["9:00-15:00"]
}
}
});
Single Configuration Object for Auto-Scheduling
DHTMLX Gantt 9.1 brings together scattered auto-scheduling settings in a single, centralized object called gantt.config.auto_scheduling:
enabled: true,
apply_constraints: true,
show_constraints: true,
project_constraint: true,
};
Note: The legacy configs are still available.
Learn more about the new configuration object in the documentation.
Other Improvements
Lastly, we would like to mention several minor changes and improvements delivered in v9.1:
- Improved touch support on Windows-based devices
- The Gantt project exported to Excel can now display split tasks
- Obsolete subscales API (gantt.config.subscales) has been removed
That’s all about the new capabilities introduced in DHTMLX Gantt 9.1. Check out the “What’s new” section for a more detailed overview of the novelties. In the migration notes, you can find the information about the new recommended format of the auto-scheduling configuration.
Download a free 30-day trial version to test the updated DHTMLX Gantt in your scenarios. Our current clients can access DHTMLX Gantt 9.1 via their Client’s Area.