Today, we are excited to announce the release of DHTMLX Diagram 6.1 introducing a new visualization mode along with enhanced flexibility and control over your code-free diagramming experience. The killer feature of this release is the new PERT mode, which enables the creation of detailed PERT charts, and what is most interesting, data syncronization with DHTMLX-based Gantt charts. The Diagram editor also received a few valuable enhancements. Now it is possible to flexibly modify the behavior of existing keyboard shortcuts and set targeted limitations for shape manipulations in the editor.
This release is shipped with a pack of live samples covering the key aspects of v6.1and a new demo demonstrating the possibility of building org charts with DHTMLX and AI.
Let us review all the novelties of DHTMLX Diagram 6.1 in more detail.
Introducing PERT Mode
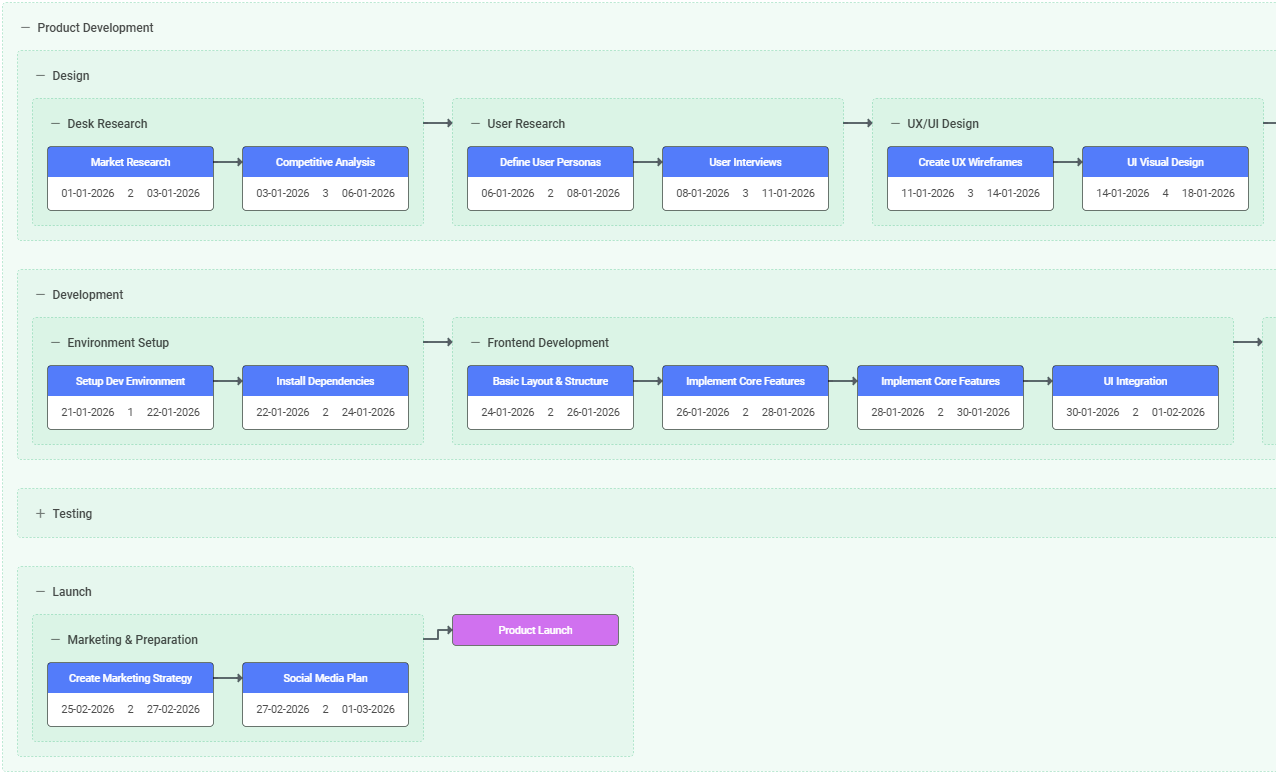
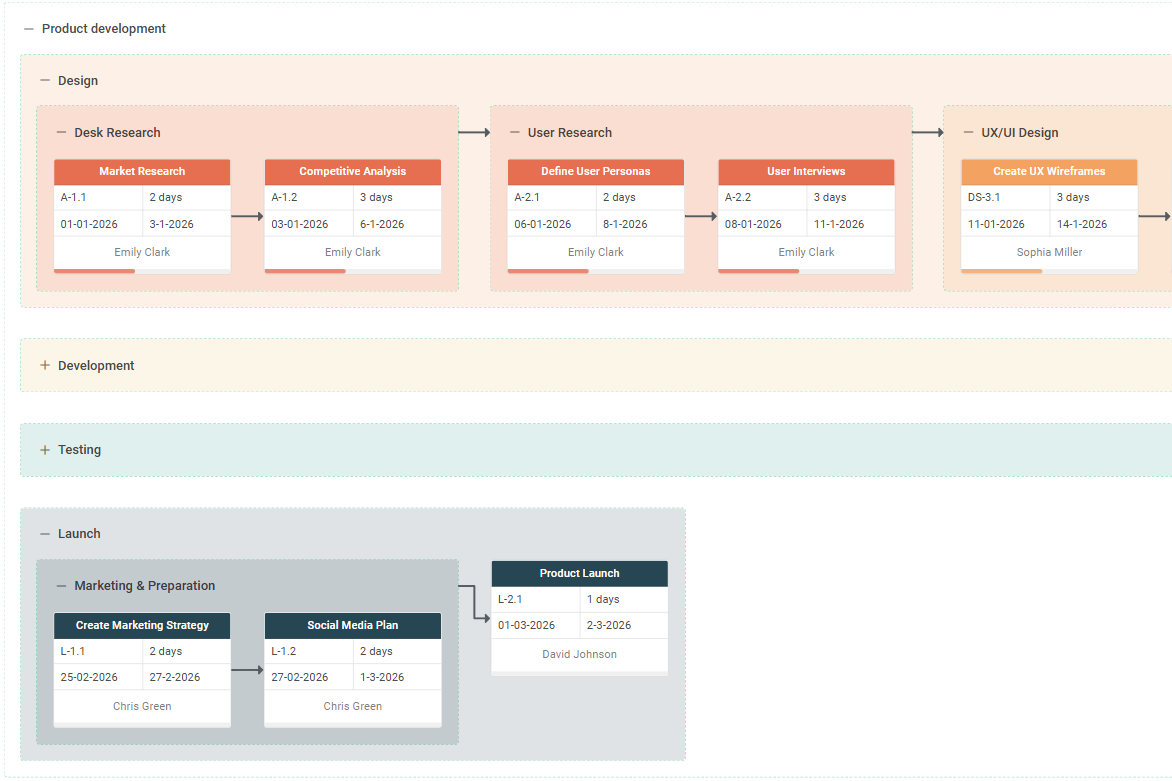
The new PERT mode of our JavaScript diagramming component offers a convenient way to create and configure PERT charts.
 Check the sample >
This type of diagram is commonly used to visualize sequences and interdependencies of tasks within a project in a clear and well-structured way. As a result, it becomes much easier to determine the critical path and estimate the overall project duration.
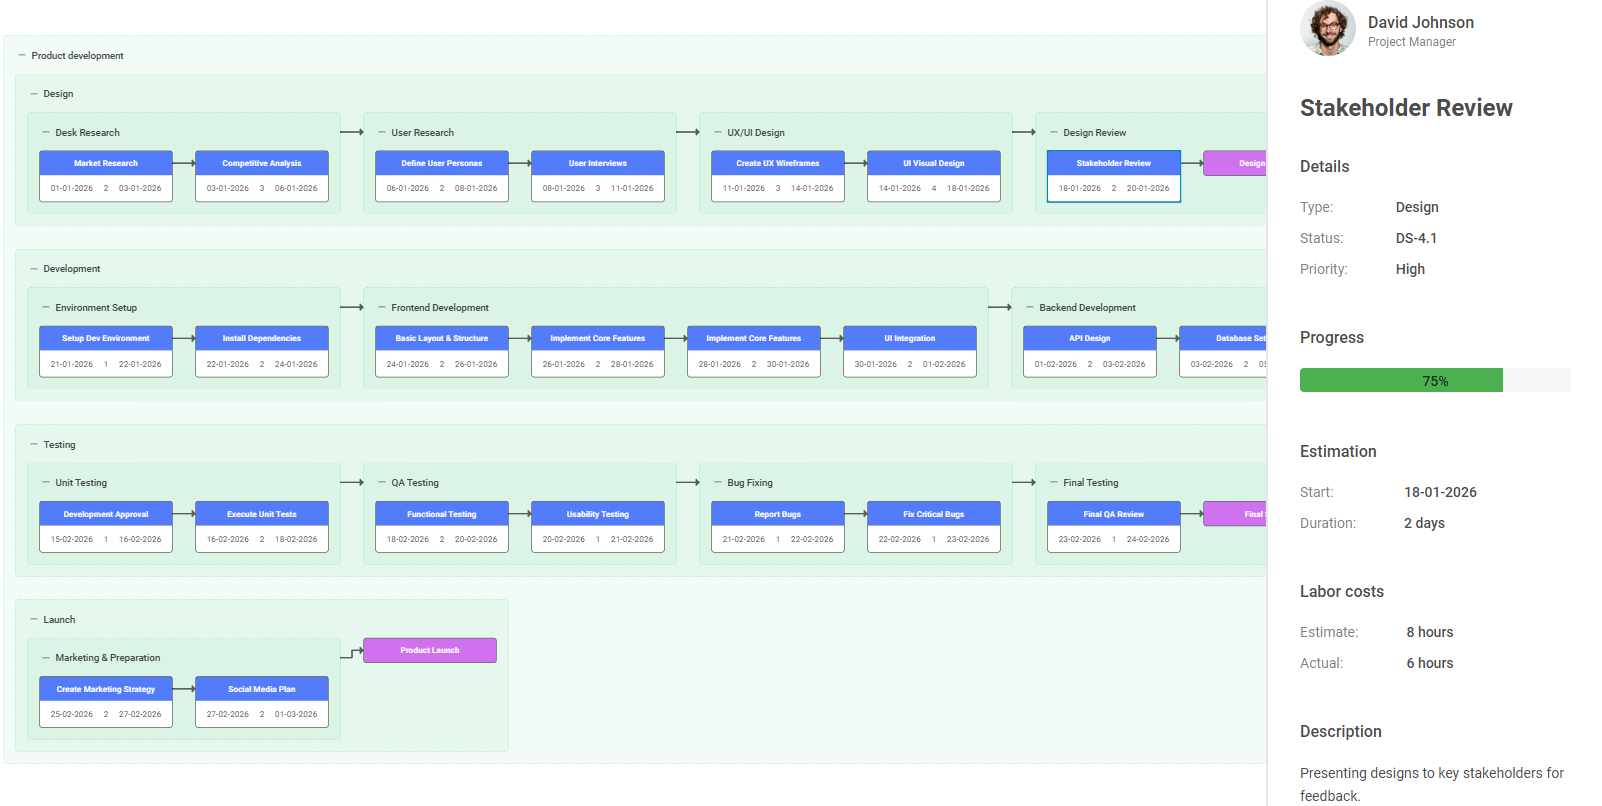
The new mode is not just another visualization option, but a great addition to our JavaScript Gantt component. From now on, it is possible to use PERT charts in combination with DHTMLX-based Gantt charts. This kind of integration provides project managers with a more coherent picture of the project. A PERT chart is well-suited for the early planning stage of a project, while a Gantt chart serves as a logical follow-up with a timeline-based overview of tasks and tracking their progress.
 Check the sample >
Let us dig deeper and see how the new mode can benefit web developers.
Developers’ Perspective on PERT Mode
You may be wondering what lies behind our decision to create a separate mode for creating PERT charts. The main reason here is to simplify the visualization process. Previously, you could build PERT charts in the default mode, but it would require extra effort on your part. You’d have to create your own templates of PERT shapes and properly organize them. With the new PERT mode, you can make use of a built-in arrangement algorithm and predefined diagram elements specifically designed for building PERT charts with ease.
Now, we can proceed to putting this mode into action and exploring other technical peculiarities of this novelty in the Diagram API.
Setting Up the PERT Mode
If you need to complement your visualization arsenal with the PERT mode, the first thing you should do is specify the newly added “pert” type in the type configuration option:
type: "pert",
});
diagram.data.parse(dataset);
The configuration of this diagram type also includes the typeConfig property with the new dateFormat parameter, which is responsible for displaying dates in the UI.
The data structure in the PERT mode matches the data structure of DHTMLX Gantt. It helps ensure a seamless integration and data synchronization between Diagram and Gantt components.
Built-in PERT Shapes
By default, the structure of PERT charts in our Diagram component includes three main elements:
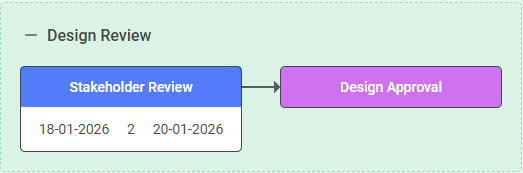
1) Task shape – represents a separate project task with the specified dates and duration.

2) Milestone shape – illustrates a project milestone without the duration.
3) Project group – serves as a container for tasks and milestones. It also supports nesting and visual grouping.
When preparing a dataset for your PERT chart, you can add specific properties for tasks, milestones, and project groups. It is worth noting that task and milestone shapes inherit common properties of other built-in shapes available in DHTMLX Diagram, while the project element adopts common group properties, some of which are automatically generated during rendering.
Customization Options
Just like other DHTMLX libraries, our Diagram component is notable for its enhanced customization capabilities, which are now also applicable in the PERT mode. For instance, you can implement the following customizations using the rich Diagram API:
- A PERT chart with a custom search bar
- Custom PERT shapes
- A custom theme

- A PERT chart with a custom sidebar
The next part of the release is dedicated to adding extra flexibility to your experience with the DHTMLX Diagram editor.
Fine-Tuning Keyboard Shortcuts (Hotkeys)
When it comes to data visualizations in our Diagram editor, the role of hotkeys goes far beyond convenience and accessibility. For many users accustomed to performing common repetitive operations via a keyboard, shortcuts provide a way to streamline the workflow and overall speed of the diagram creation. But what if your project requirements do not imply the use of shortcuts or demand some custom behavior on a specific key combination? Starting from v6.1, you can easily meet such requests.
The updated Diagram Editor API now includes the hotkeys property that allows making necessary adjustments for keyboard shortcuts in the DiagramEditor configuration object. Using this property and its parameters, you can manage keyboard shortcuts as follows:
- Disable all hotkeys
hotkeys: false,
});
- Disable specific hotkeys
hotkeys: {
"ctrl+c": false,
"ctrl+v": false
},
});
- Override hotkey behavior
editor = new dhx.DiagramEditor("editor_container", {
hotkeys: {
// Overrides the "delete" key to remove selected elements
"delete": () => editor.diagram.data.remove(editor.diagram.selection.getIds()),
// Adds a custom hotkey "ctrl+f"
"ctrl+f": () => console.log("custom search"),
},
});
Here is the list of all hotkey combinations available for the DHTMLX Diagram editor.
Finer-Grained Control Over Interactions with Shapes
Previously, you could prevent users from moving, resizing, or rotating particular shapes in the Diagram editor. You just needed to set the value of the fixed property to true, but it disabled all the mentioned actions, which might be an obstacle when a more flexible approach was required. This is no longer an issue.
DHTMLX Diagram 6.1 offers a package of events that allow you to set rules for resizing and rotating interactions separately: beforeItemResize, afterItemResize, itemResizeEnd, beforeItemRotate, afterItemRotate, and itemRotateEnd. Check out this sample to see how these events work in practice.
To top it all off, we prepared a new DHTMLX Diagram Org Chart AI Builder demo and other useful samples covering various aspects of using the new PERT mode, examples of a fishbone diagram, interactive electrical schematic diagram, and options for adding watermarks when exporting to PDF/PNG.
That’s all about the novelties included in this minor update of DHTMLX Diagram. Check the “What’s New” section to look through the main additions to v6.1 once again.
If you want to try the new PERT mode and other new capabilities in your own scenarios, you are welcome to download a free 30-day trial version of our Diagram component.
As a bonus, now you have a lucrative opportunity to combine PERT charts and other diagram types with a powerful Gantt chart by bundling DHTMLX Gantt and Diagram licenses at a 20% discount.
Current customers can access DHTMLX Diagram 6.1 via their Client’s Area.