Originally published: September 29, 2017
Updated: April 4, 2020
The story of our JavaScript organization chart library begins today. Meet dhtmlxDiagram, our brand new js component, that will allow you to add interactive diagrams such as organization charts to your applications.
Org Charts
Under the first release, dhtmlxDiagram 1.0 features the ability to build organization charts of any complexity. An organizational chart represents the most natural way of displaying the hierarchical structure of an organization. You can use it to show the structure of a company, business, or project team. View samples
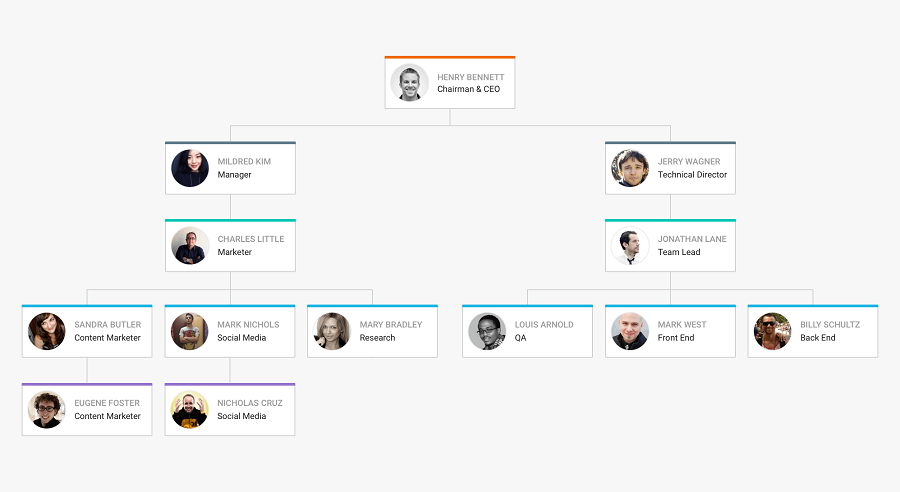
Such diagrams may have different purposes. You can use them as management tools that help to define the area of responsibility for each team member, as a personnel directory, etc.
Organizational charts display work responsibilities in an intuitive way which allows improving the work of communication lines and helps each member of the organization understand how their work fits into the overall scheme.
What makes dhtmlxDiagram so good?
- All dhtmlx libraries provide extensive JavaScript API for flexible configuration and dhtmlxDiagram is not an exception.
- 3 predefined types of nodes: text, image, or any other custom HTML and SVG element. You also have the ability to create custom nodes based on your needs.
- Provide a custom and unique look and feel for your org chart through CSS.
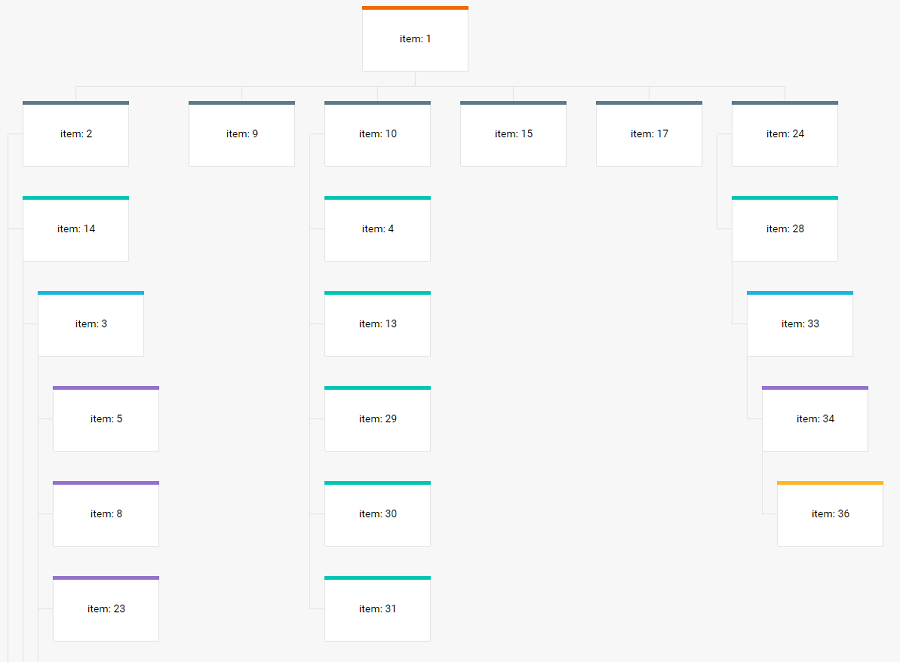
- You can enable vertical mode to provide a compact view for your diagram.
- Being a 100% JavaScript library, dhtmlxDiagram can be used with any server side without any limitations.
- Our JavaScript Organization chart will be perfectly rendered in all modern web browsers.
Find out more about DHTMLX JavaScript diagram library
What’s New in the Next Updates?
The next 4 updates have significantly enlarged our JavaScript diagramming library. New types of js diagrams with a wide range of shapes and connectors were added:
Besides, our dev team has designed special live editors for JavaScript org charts and all other diagram types. These handy editors can be easily initialized, so that end users can edit different diagram types or build diagrams from scratch and view the changes made to diagrams on the fly. Edited org charts and diagrams can be exported to the JSON format right from the editor.
With the introduction of SVG and HTML templates, DHTMLX Diagram now allows both adding new custom shapes for creating such diagram types as network diagrams, life cycle diagrams, Venn diagrams, and whatnot, and customizing the existing ones. Moreover, it is also possible to combine flowchart and org chart shapes in one diagram. On top of all, DHTMLX Diagram has become much more customizable with brand new options for configuring each and every diagram element.
Ready to start?
- Download dhtmlxDiagram right now
- Visit JavaScript Diagram page to check the live demo
- Check documentation and samples
With dhtmlxDiagram, you can use different types of organizational charts, flowcharts, decision trees, and other diagrams to create a visual representation that better reflects the structure of your company, helps you illustrate its processes and workflows and make better decisions.
Stay tuned!