Another popular diagram type available in dhtmlxDiagram library is a javascript decision tree. It serves as a useful tool for making decisions or predicting events in various fields. Download dhtmlxDiagram 30-day trial version for testing this and other diagram types.
Where Javascript Decision Trees Are Applied
Javascript decision trees are used by developers to build analytics tools, which enable end-users to visualize and weigh alternatives in order to find the best solution. That might be alternative investment options, possible causes of business failures, a choice of some crucial aspects, for example, what product features to develop, or any other kind of dilemma.
Tree diagrams, on the whole, are broadly applied to illustrate different choices, conditions, risks, or objectives in numerous fields. Let’s highlight the main purposes of building a tree diagram:
- Situation analysis takes advantage of decision trees to compare the outcomes of decisions to be made taking into account possible profit or loss.
- Decision trees are applied for calculating probability and predicting events (for instance, estimating chances of an airplane crash by airlines).
- Decision trees facilitate deduction helping to draw different conclusions to the matter in question or extract detailed information from a broad concept. These methods are often involved in data mining processes.
- Building decision trees is useful for uncovering discrepancy, knowledge gaps, and logical fallacies and, thus, is good for brainstorming.
- This diagram type is also suitable for describing qualities of items (for example, company’s products, services or events for analysis or further design).
Evidently, decision trees are powerful tools in maths and sciences. By showing the logic of things they also assist analysts with making decisions, forecasting events, and strategic planning. That’s why it’s a crucial instrument in the organization’s management and business analysis. Besides, decision trees are used in machine learning, computer sciences, and game theory.
Drawing a Decision Tree
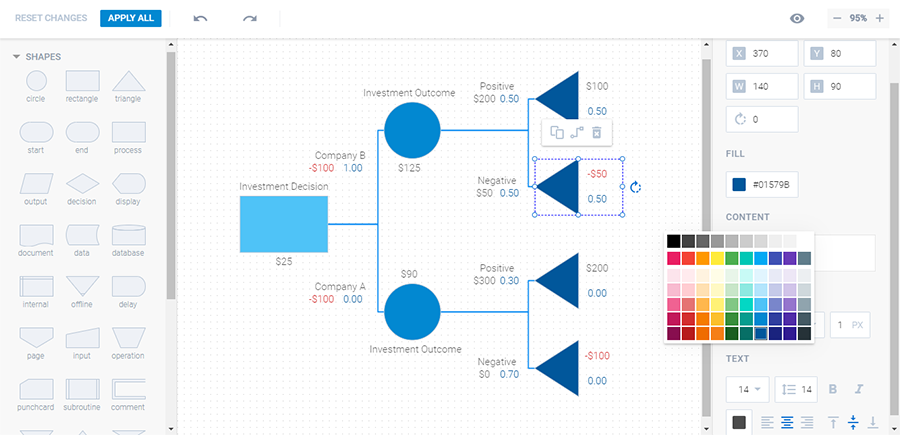
Let’s take a look at the following decision tree diagram. It deals with the necessity to make a business decision on which company to invest resources: in company A or company B. Two branches of the tree represent outcomes for investing in company A and B and both positive and negative effects of that decision.
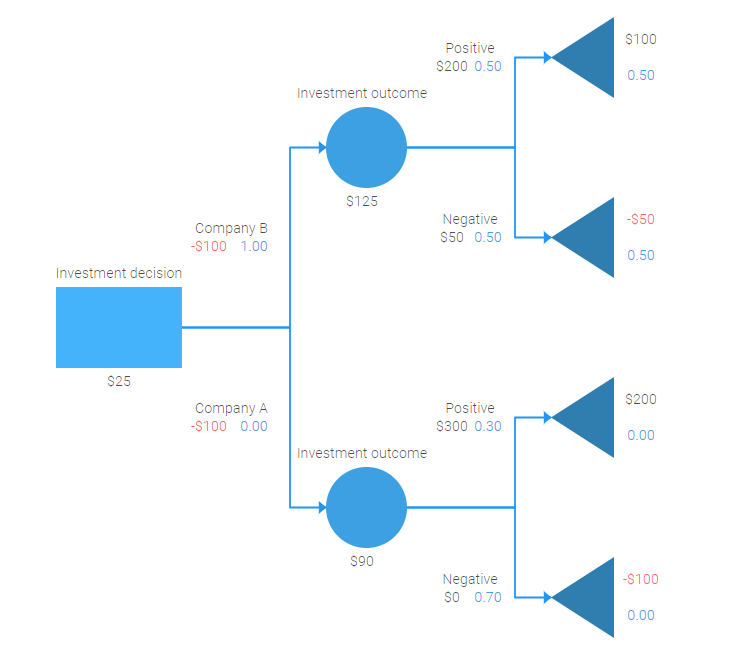
In most cases decision trees are drawn with the help of 3 types of nodes:
The rectangular node is the main one, which represents a decision to be made (investment decision in the diagram above).
Circular nodes are situated on separate tree branches and stand for possible alternatives: investing in company A or B.
Triangular nodes, which are also called endpoint nodes and may remind you of tree leaves, illustrate what the possible consequences of the two alternatives are, how beneficial the investment decision may turn out for the company.
Decision tree diagrams are usually drawn from left to right. Nodes are connected with arrows. Besides, there may be included text and numbers for showing the amount of resources to be invested, gained, or lost as in the example above.
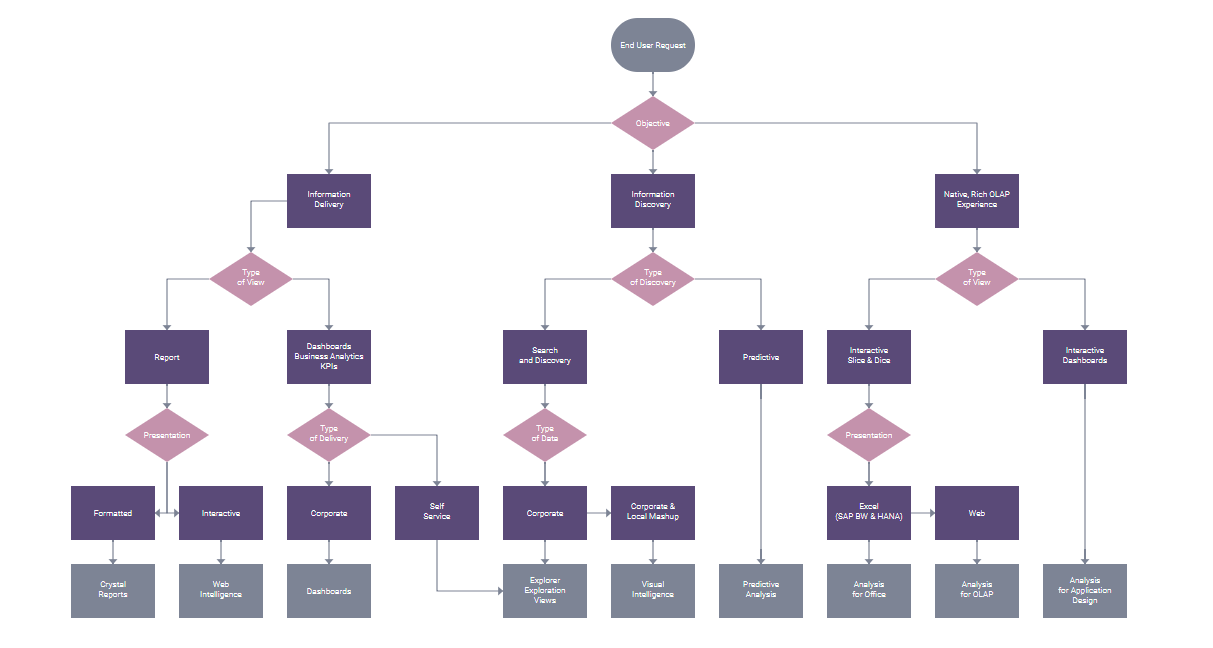
However, it’s also possible to create a tree diagram with branches spreading from top to bottom. Tree diagrams may also include other flowchart shapes. An example of such a vertical tree describing information characteristics is shown below:
The tree-like structure of decision trees opens up lots of opportunities for the application of this diagram type in various fields. They are very informative, as they may combine text and numbers. At the same time, these diagrams are neat and easy to read and understand. That’s why building a decision tree is a fast way to arrive at a particular conclusion and estimate potential results.
Javascript Decision Tree in dhtmlxDiagram Library
Javascript decision trees are part of our javascript diagram library, which also includes flowcharts, org charts, activity diagrams, block diagrams etc. Building all these diagram types is simple and convenient.
Flexible Customization
Each aspect of your graphic javascript tree can be changed and styled the way you prefer via CSS or shapes and connectors object properties. Here you can see how some parts of the investment decision tree were configured:
{ id: 1, x: 0, y: 400, text: "", type: "rectangle", css: "decision" },
{ id: 2, x: 300, y: 200, width:90, text: "", type: "circle", css: "outcome" },
{ id: 3, x: 300, y: 600, width:90, text: "", type: "circle", css: "outcome" },
{ id: 4, x: 550, y: 100, text: “”, type: “endpoint”, css: “endpoint” },
{ id: 5, x: 550, y: 300, text: “”, type: “endpoint”, css: “endpoint” },
{ id: 6, x: 550, y: 500, text: “”, type: “endpoint”, css: “endpoint” },
{ id: 7, x: 550, y: 700, text: “”, type: “endpoint”, css: “endpoint” },
{ id: 8, “x”: 70, “y”: 390, type: “text”, text: “Investment decision” },
{ id: 9, “x”: 70, “y”: 510, type: “text”, text: “$25” },
{ id: 10, “x”: 195, “y”: 540, type: “text”, text: “Company A” },
{ id: 11, “x”: 170, “y”: 560, type: “text”, text: “-$100”, css: “neg” },
{ id: 12, “x”: 220, “y”: 560, type: “text”, text: “0.00”, css: “pos” }
// connectors
{ from: 1, to: 2, type: “line”, fromSide:”right”, toSide:”left”, forwardArrow: “filled” },
{ from: 1, to: 3, type: “line”, fromSide:”right”, toSide:”left”, forwardArrow: “filled” },
{ from: 2, to: 4, type: “line”, forwardArrow: “filled” },
{ from: 2, to: 5, type: “line”, forwardArrow: “filled” },
{ from: 3, to: 6, type: “line”, forwardArrow: “filled” },
{ from: 3, to: 7, type: “line”, forwardArrow: “filled” }
]
Object properties allow you to define the color of the shape and its outline, the type and width of the outline, the pattern of dashes and gaps if it has a dashed stroke and many other properties for shape and connector objects. Styling via CSS also gives you lots of freedom to refine your diagram even further.
On top of all, the rich API of dhtmlxDiagram permits you to add, delete, and update shapes and diagram content easily so that you can modify your existing diagram whenever needed.
After you’ve finished creating your javascript tree visualization you can easily save it in pdf or png formats.
Interactive Diagram Editor
One of the coolest features introduced in dhtmlxDiagram 2.1 is a diagram editor. It gives end users a great opportunity to build decision trees from scratch with the help of an interactive editor interface. Drag and drop shapes from the left panel, add connectors between them, set other attributes such as the shapes’ arrangement, color, and content, and achieve the desired look and feel of your diagram.
A diagram editor can be easily initialized (read more in our guide). Besides, the editor may be used as a small application, which allows you to switch from the editor view to the diagram view for saving recent changes and verifying them at once.
Easy Integration Into Any Web App
Our library works equally well in all major web browsers and allows using any server-side technologies. As the learning curve for dhtmlxDiagram is quite short, it will take you just a few minutes to integrate it into your app.
Conclusion
Decision trees complement a range of tools for conducting analysis for various purposes. Being both informative and elegant they provide an intuitive way to find optimum solutions in unclear situations visualizing potential outcomes. Creating these diagrams takes a few steps: describe a decision to be made in the decision node, draw all possible options on diagram branches, and assess the expected results in the leaflike endpoint shapes.
Our JavaScript Diagram library provides a rich functionality to develop javascript/html interactive decision trees and other diagram types with flexible customization, smooth integration and user-friendly editor for end users. To get a more detailed insight into the use and features of our diagram library, consult our documentation.
Try out javascript tree diagrams in dhtmlxDiagram evaluation version.
Don’t hesitate to contact us if you have any questions and leave your feedback on the usage of decision trees in the comments below.