JavaScript activity diagrams represent UML diagrams in our library. Their main purpose is to describe step-by-step activities and provide guidelines. You can test this diagram type in our 30-day trial version of dhtmlxDiagram.
Activity diagrams in UML reflect the behavior of a system or person. For that reason they’re often defined as behavioral diagrams. This means that they are used for showing how something behaves under certain circumstances taking into account different scenarios.
This diagram type is widely spread in business analysis for illustrating particular business use cases and activities involved in them. However, UML activity diagrams may be applied even on a larger scale describing any workflow, which shows all possible occurrences in the course of events.
 View the Whole Activity Diagram
Another field of use of activity diagrams is programming. Developers apply this diagram type to formulate how a system or program should behave. It concerns both simple operations and more complicated functions.
How to Draw Activity Diagram
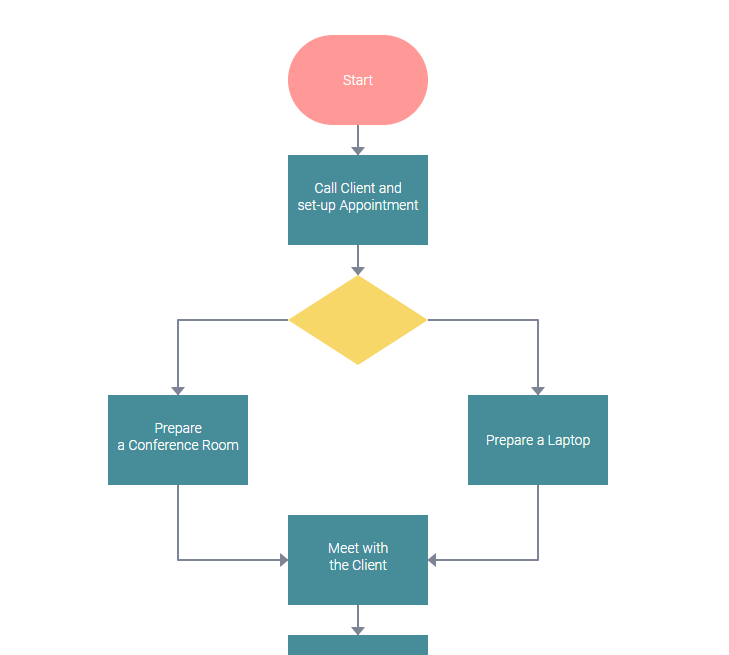
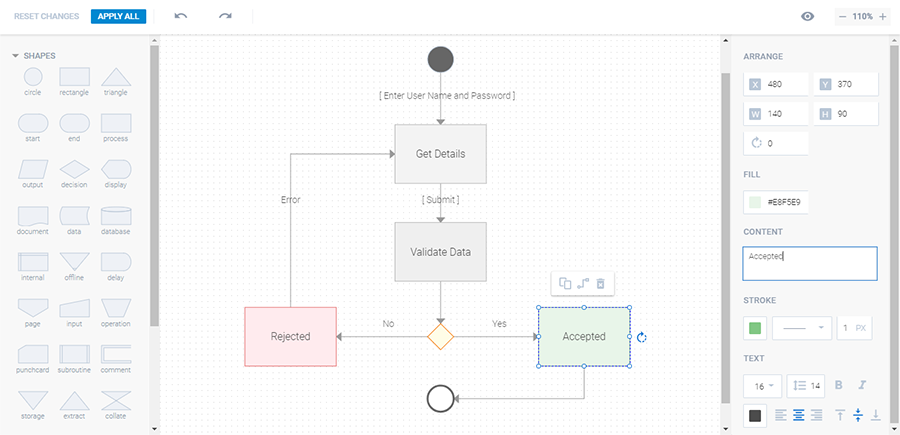
UML activity diagrams are distinguished by the possibility to illustrate parallel activities. For example, the first activity diagram we had a look at above describes the necessity to prepare both a room and laptop for meeting a client that is shown by parallel arrows leading to two different rectangular shapes.
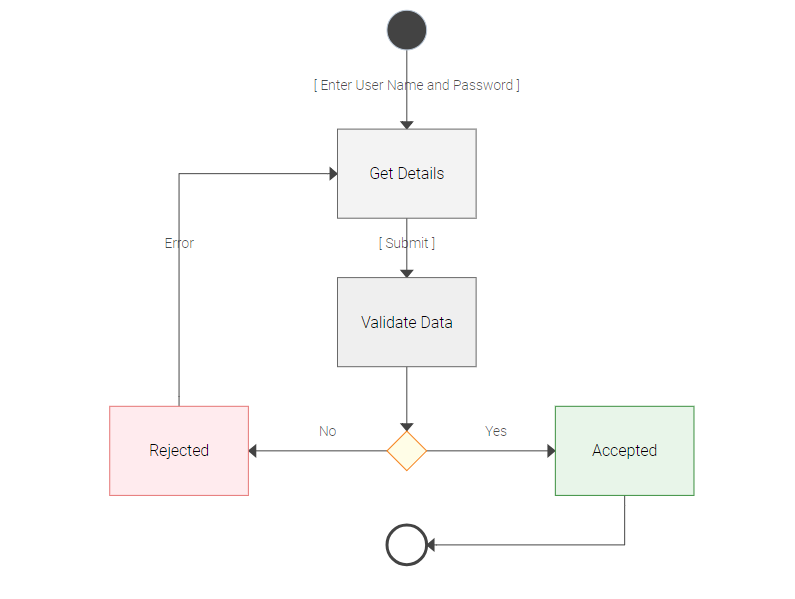
These diagrams may also include iterations when an error or other unfavorable event occurs, and an arrow is being directed to one of the previous activities to be repeated.
Activity diagrams are usually built using 3 types of shapes:
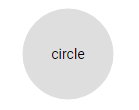
The circle shape marks the start and end points of activity diagrams.
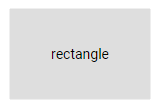
Rectangles reflect activities themselves – what needs to be done.
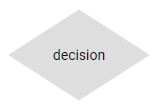
Decision shapes serve as crossroads, a point where there’re two or more possible ways to follow. It occurs when an activity results in several outcomes, which lead to different steps to be taken next. Arrows flow out of decision shapes and are directed to separate rectangles to create several scenarios for further activities.
Besides, these diagrams may include other flowchart shapes – for example, to illustrate the connection with another diagram.
Nodes are linked with arrows showing the flow of activities. In order to make a diagram more descriptive, textual notes are often provided near shapes and arrows.
Tips to Build Javascript Activity Diagrams with DHTMLX
dhtmlxDiagram library consists of plenty of diagram types like flowhcarts, org charts, decision trees, and UML activity diagrams among them. All these JavaScript diagrams are highly customizable, can be rendered well in all major web browsers and are easily built involving any server-side technologies. Our extensive API gives you lots of maneuver to tailor your diagram entirely to your needs.
Below you can check the configuration of this activity diagram via CSS and shapes’ and connectors’ object properties:
{ "id": "start", "x": 200, "y": 0, "type": "start", text: "Start", css: "start" },
{ "id": 1, "x": 200, "y": 120, "text": "Call Client and \n set-up Appointment", "type": "process" },
{ "id": 2, "x": 200, "y": 240, "text": "", "type": "decision", css: "decision" },
{ "id": 3, "x": 20, "y": 360, "text": "Prepare \n a Conference Room", "type": "process" },
{ "id": 4, "x": 380, "y": 360, "text": "Prepare a Laptop", "type": "process" },
{ "id": 5, "x": 200, "y": 480, "text": "Meet with \n the Client", "type": "process" },
{ "id": 6, "x": 200, "y": 600, "text": "Send \n Follow-up Letter", "type": "process" },
{ "id": 7, "x": 200, "y": 720, "text": "", "type": "decision", css: "decision" },
{ "id": 8, "x": 200, "y": 840, "text": "Create Proposal", "type": "process" },
{ "id": 8.1, "x": 30, "y": 840, "text": "See the \n Activity Diagram \n for creating \n a document", "type": "document" },
{ "id": 9, "x": 200, "y": 960, "text": "Send Proposal \n to Client", "type": "process" },
{ "id": 10, "x": 200, "y": 1080, "type": "end", text: "End", css: "start" },
{ id: 11, "x": 110, "y": 270, type: "text", text: "[appointment onside]" },
{ id: 12, "x": 430, "y": 270, type: "text", text: "[appointment offside]" },
{ id: 13, "x": 440, "y": 750, type: "text", text: "[no statement of problem]" },
{ id: 14, "x": 150, "y": 820, type: "text", text: "[statement of problem]" },
{ from: “start”, to: 1, type: “line”, forwardArrow: “filled” },
{ from: 1, to: 2, type: “line”, forwardArrow: “filled” },
{ from: 2, to: 3, type: “line”, forwardArrow: “filled” , toSide: “top” },
{ from: 2, to: 4, type: “line”, forwardArrow: “filled” , toSide: “top” },
{ from: 3, to: 5, type: “line”, forwardArrow: “filled” },
{ from: 4, to: 5, type: “line”, forwardArrow: “filled” },
{ from: 5, to: 6, type: “line”, forwardArrow: “filled” },
{ from: 6, to: 7, type: “line”, forwardArrow: “filled” },
{ from: 7, to: 8, type: “line”, forwardArrow: “filled” },
{ from: 8, to: 8.1, type: “dash” },
{ from: 8, to: 9, type: “line”, forwardArrow: “filled” },
{ from: 9, to: 10, type: “line”, forwardArrow: “filled” },
{ from: 7, to: 10, type: “line”, fromSide: “right”, toSide: “right”, forwardArrow: “filled” }
With the help of our documentation you can grasp all tips about styling activity diagrams using CSS and object properties. Anything from the colors of diagram elements to their arrangement can be customized the way you prefer. Besides, you can make changes to your diagram anytime adding or deleting shapes and their content.
End-users enjoy an opportunity to build and edit UML activity diagrams by means of the live editor equipped with interactive panels with a large choice of shapes and connectors and tools for styling them.
Our guide provides instructions on initializing the editor and using it by the example of a small application to be able to view all the latest changes immediately in the view mode.
Our online export service also allows you to download a ready diagram in a pdf or png format.
Conclusion
The definition of activity diagram in UML describes this diagram type as an illustration of step-by-step activity flows. Activities are based on various conditions and may evolve into different outcomes. Thus, activity flow diagrams cover all possible occurrences in the behavior of a system or person in question. It makes them very useful for analysing business use cases or describing a system’s behavior in programming.
Our diagram library supplies you with all the necessary tools for building eloquent and comprehensive activity diagrams. Just give it a try in our 30-day evaluation version.
If you have any questions on how to draw activity diagrams using our library, contact us.
Stay tuned for future reviews of different diagram types from dhtmlxDiagram!