In search of the right tool for visualizing systems and concepts don’t forget about a simple and effective decision offered by JavaScript block diagrams. This diagram type helps to illustrate swiftly the main parts of a system or subject in question. You can download our diagramming library with this and other diagram types for 30-day evaluation.
Block diagrams are usually used for a brief description of a system, process, or concept at the initial stage of work. They’re widespread in such fields of applied science as engineering, electronics, computing, etc. for creating drafts of projects, general illustration of systems, programs, and software applications. Details are omitted from block diagrams in order not to distract attention from the core elements and provide an overview of a system as a whole. In the future, such a diagram may be elaborated or divided into several diagrams to help with the further design process.
Besides, you may find it useful to fall back on JavaScript block diagrams as a means of sketching your ideas, project steps, or main points of something.
Drawing Block Diagrams
All elements of block diagrams play an equal role in visualization. They’re represented by similar rectangles, which are often treated as “black boxes”.
It’s not relevant to know what these elements consist of themselves to the process of creating block diagrams, but more important is their interconnection. There might be no hierarchy in block diagrams and their elements may be organized in a closed circuit.
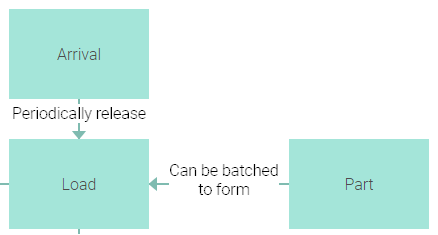
Arrows denote the flow of data from one block to another and indicate how the diagram should be read. To make it clearer, captions may be provided beside shapes for adding brief explanations.
Building JavaScript Block Diagrams with DHTMLX
JavaScript block diagrams are included in DHTMLX diagramming library together with such diagram types as org charts, workflow diagrams, decision trees, UML diagrams etc. All these diagrams are easily integrated into an app due to rich API, extensive browser support and simple implementation with various frameworks and technologies. The data can be loaded to js block diagrams in the JSON format (check docs about data loading).
The flexibility of customization options enables you to build block diagrams from scratch exactly the way you need and polish their look and feel to meet all the requirements of your project. Here is the full list of shapes’ and connectors’ object properties. Our guide to CSS styles will help you finalize your diagram’s look and feel. Besides, there are many different operations allowing you to manipulate diagram shapes – add new shapes, delete old ones, update shapes’ content, filter shapes and what not.
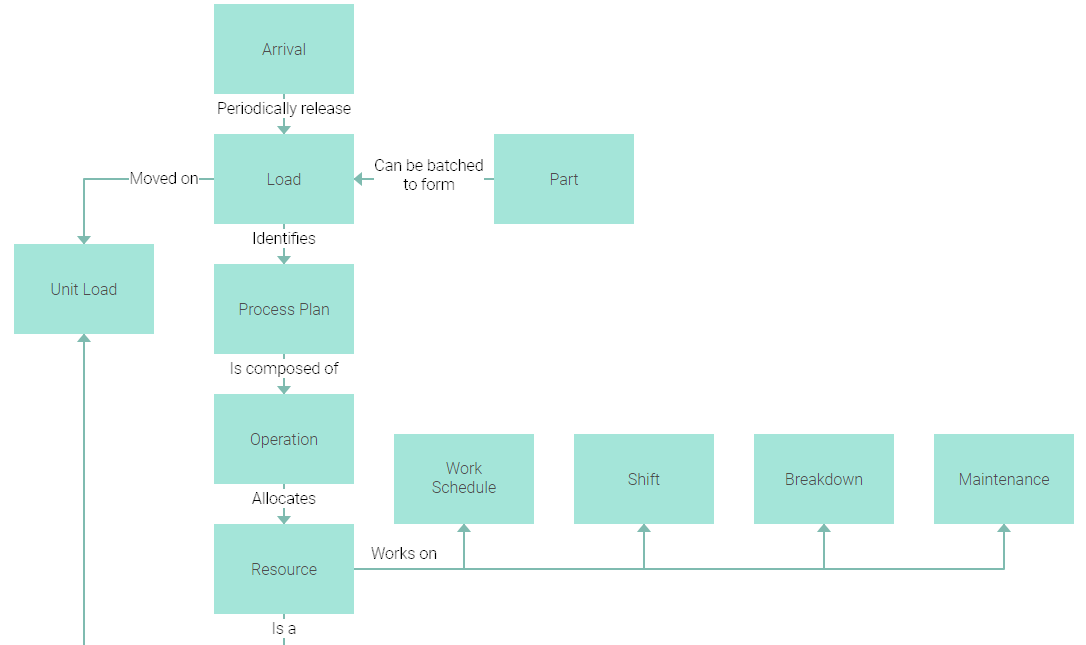
Let’s take a closer look at how our JavaScript block diagram was configured via CSS and shapes’ and connectors’ object properties:
{ "id": 1, "x": 200, "y": 0, "text": "Arrival", "type": "process" },
{ "id": 2, "x": 200, "y": 130, "text": "Load", "type": "process" },
{ "id": 2.1, "x": 480, "y": 130, "text": "Part", "type": "process" },
{ "id": 3, "x": 200, "y": 260, "text": "Process Plan", "type": "process" },
{ "id": 3.1, "x": 0, "y": 240, "text": "Unit Load", "type": "process" },
...
{ "id": 19, "x": 270, "y": 500, "text": "Allocates", "type": "text" },
{ "id": 20, "x": 390, "y": 555, "text": "Works on", "type": "text" },
{ "id": 21, "x": 270, "y": 630, "text": "Is a", "type": "text" },
{ "id": 22, "x": 940, "y": 790, "text": "Connected through", "type": "text" },
...
{ from: 2, to: 2.1, type: "line", backArrow:"filled" },
{ from: 2, to: 3.1, type: "line", forwardArrow: "filled" , toSide: "top" },
{ from: 3, to: 4, type: "line", forwardArrow: "filled" },
{ from: 4, to: 5, type: "line", forwardArrow: "filled" },
{ from: 5, to: 5.1, type: "line", forwardArrow: "filled" , toSide: "bottom" },
{ from: 5, to: 5.2, type: "line", forwardArrow: "filled" , toSide: "bottom" },
{ from: 5, to: 5.3, type: "line", forwardArrow: "filled" , toSide: "bottom" },
{ from: 5, to: 5.4, type: "line", forwardArrow: "filled" , toSide: "bottom" },
...
{ from: 5, to: 10, type: "line", forwardArrow: "filled" , fromSide: "bottom", toSide: "top" },
{ from: 5, to: 11, type: "line", forwardArrow: "filled" , fromSide: "bottom", toSide: "top" },
{ from: 5, to: 12, type: "line", forwardArrow: "filled" , fromSide: "bottom", toSide: "top" },
{ from: 5, to: 13, type: "line", forwardArrow: "filled" , fromSide: "bottom", toSide: "top" },
]
dhtmlxDiagram library makes lots of room for tailor-making diagrams not only by developers, but also by end-users due to a special diagram editor. It’s easily initialized and may be used as an application for creating diagrams from scratch without coding, customizing their appearance, saving changes and viewing them on the fly.
After you’ve finished designing block diagrams save them by exporting to PDF or PNG formats.
Conclusion
Block diagrams join a wide range of various JavaScript diagram types in our library and give you the advantage of a simple yet effective way for quick general visualization of systems and concepts, creating drafts and sketches, and documenting ideas in a clear and compact way.
DHTMLX diagram library supplies you with a robust tool for building highly customizable JavaScript block diagrams and integrating them to any project. Our 30-day trial version lets you test all the features of our library and provides support from our dev team for the evaluation period.
Check the related materials and keep an eye on the recent updates!
Related Materials:
- Full DHTMLX diagram documentation
- All diagram samples