Updated on September 13, 2022
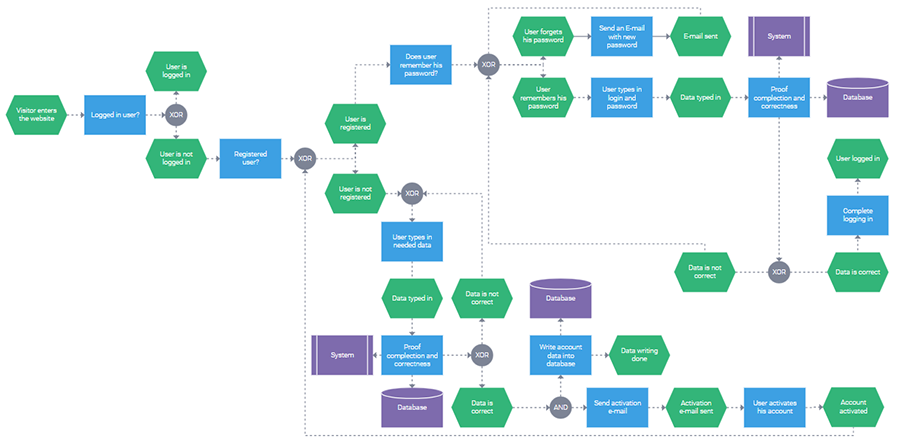
The DHTMLX Diagram library consists of various types of diagrams. One of the most widely used is a JavaScript flowchart, which shows any kind of workflow, process, or system. You can download the evaluation version of DHTMLX Diagram and try it out yourself.
What Are Javascript Flowcharts For?
A javascript flowchart (otherwise called a javascript workflow diagram, process flow, or simply flow diagram) can be integrated into an app for visualization of company’s activities. It can reflect the whole business process, workflow in certain departments, or steps of a single operation. The scope of your diagram depends entirely on the needs of end-users.
Let’s have a look at some of the cases when building a flowchart may be useful:
- Illustrating a process with this diagram type helps company’s members better understand this process and what it comprises.
- Finding errors, drawbacks and weak points gets much easier with a detailed workflow representation in a flowchart.
- Flowcharts are very effective for explaining complicated issues to coworkers or team members, as they show the process step by step.
- These diagrams can also be used while brainstorming to visualize a problem, ways of solving it or what should be improved.
As you can see, js flowcharts serve lots of different purposes. For that reason, they’re applied in a wide range of fields. We’ll give several examples.
Flowcharts are frequently used in programming to describe complex sequences and subjects like user’s path on the website, code structure, or software architecture.
Business modeling also benefits from js workflow diagrams for illustrating business processes, building strategies, visualizing infrastructure, and other objectives.
Process flow diagrams are considered to be handy tools for project managers, as they perfectly fit for showing steps of a project.
Flowcharts are also popular in the field of enterprise resource planning to demonstrate the flow of human, financial, manufacturing, or any other resources.
Besides, they are often applied in scientific methods and research.
How Flowcharts Help to Visualize Data
Flowcharts can be used in numerous ways to visualize data due to the variety of graphic elements characteristic of this diagram type. You can combine flowchart elements in a unique way to illustrate what you need.
Our library provides more than 30 different types of flowchart shapes, each type meant for a particular purpose. Here are the most frequently used shapes:
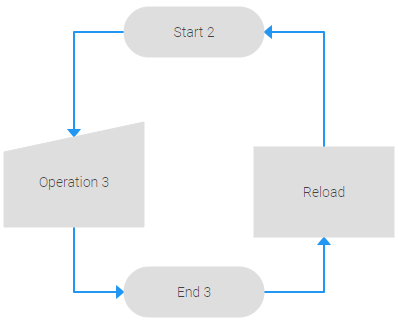
In many cases, a flowchart starts with a “start” shape and ends with an “end” shape, which mark the beginning and finishing points of a process.

“Process” shapes are drawn in the middle of a flowchart as certain steps of a process, for example, as an action to be taken by users on the website. Meanwhile, process steps are based on “preparation” shapes that describe the conditions in which the process is flowing (for instance, user is not logged in).

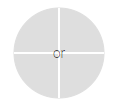
The “or” shape allows adding several possible outcomes of previous steps.
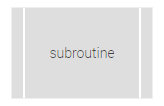
You can also make use of “subroutine” shapes, which are predefined process shapes linking to an existing process in another flowchart.
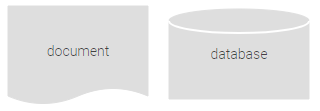
Among other common shapes are “database” and “document” shapes. Their names speak for themselves.
Apart from shapes, connectors also play an important role for building a flowchart, as they show how flowchart elements are related to each other and guarantee that your diagram is read correctly.
Why Build Javascript Flowcharts with DHTMLX Diagram
Being able to manipulate a flowchart is significant for workflow visualization. Rich and flexible API gives an opportunity to achieve any goal you set with our javascript/html5 workflow diagram.
1. Setting up flowchart elements with multiple configuration options
When you start building a JavaScript flowchart with DHTMLX, you’ll certainly appreciate plenty of useful configuration options. Here you have an opportunity to specify the default type for shapes and lines, margin between shapes, toolbars with icons for shapes, tooltips, and much more.
If you need any particular flowchart shape type available in our library, just set it as a value in the type property inside the shape object. Similarly, the line type for an individual connector is specified using the type property in the line object.
To save time when preparing data for a complex flowchart, you can specify the default configuration for all shapes and connector lines at once using the defaults property. This approach will also help to improve readability of your code. Check the full list of configuration options in this section of our documentation.
2. Customizing and styling each flowchart element to tailor it to your needs
Another key strength of our JavaScript diagramming library is its enhanced customizability. You can play around with the styling settings for shapes and connector lines in their objects and redefine the corresponding CSS classes. Thus, it won’t be a problem to adjust the appearance of the main flowchart elements to the requirements of your project. Text content in shapes can be easily changed via inline editing.
If that’s not enough, there is a possibility to create custom flowchart shapes and define templates for them. For adding your own shape to the flowchart, you should use the addShape method. Visit this page to learn more about customization capabilities of DHTMLX Diagram.
3. Manipulating shapes freely via API to make changes whenever needed
Our js flowchart is highly flexible when it comes to manipulating diagram items via the component’s API.
For instance, if you want to build a large flowchart, you won’t need to bother your head about arranging the whole structure in a proper order. There is a special auto-layout algorithm that will do the job for you much faster. The algorithm turns an array of randomly linked shapes into a nice-looking hierarchical structure with the orthogonal or radial positioning of shapes. During the auto-placement, shapes can be connected with diagonal (direct mode) or right-angle (edges mode) connector lines.
This functionality is enabled in two ways:
- with the autoplacement property:
diagram.data.parse(data);
diagram.autoPlace({
mode: “direct”| “edges”,
placeMode: “orthogonal”|”radial”
});
- with the autoPlace() method:
type: "default",
autoplacement: {
mode: "direct"| "edges",
placeMode: "orthogonal"|"radial",
}
});
It is also always possible to add new shapes, delete the old ones or even start your diagram from scratch by using the related data collection API.
The add method enables you to add new shapes to your flowchart:
Deleting some of the shapes you don’t need or even all of them can be done with the remove method:
If you’re satisfied with the shapes you have, but their content needs to be improved, you can apply the update method to place new data into your shape.
4. Making wide flowcharts easy-to-read and analyze
Wide flowcharts with lots of data don’t cause trouble to you and your end users anymore thanks to zooming and scrolling features. Taking into account your flowchart’s size, you can zoom in or out with the help of the scale property:
diagram.data.parse(data);
Another option is to add horizontal and/or vertical scrolls for viewing your flowchart.
In order to facilitate the work with elaborate structures for end-users, you can also complement a flowchart with swimlanes that help to divide the whole visualized process into separate stages like in this sample.
One more useful feature here is the ability to clarify tricky parts of the flowchart via titles on connector lines.
5. Exporting flowcharts to PNG and PDF
Your process visualization can be easily saved, stored, and shared with others if you export your flowchart to png or pdf.
The pdf or png export methods permit not only exporting diagrams as they are, but also adjusting the export settings:
diagram.export.png({
type:"jpeg"
fullPage: true
});
6. Providing seamless front-end and back-end integration
What is really vital, our javascript flowcharts can be integrated into any web app built with any client-side and server-side technologies. Data is easily loaded into your diagram in the JSON format. We provide demos that will give you a clear understanding of how to integrate DHTMLX Diagram into apps based on popular JavaScript frameworks (Angular, React, Vue.js). With DHTMLX Diagram, your flowcharts will perform equally well on any touch devices and in all modern browsers.
7. Building a flowchart in the DHTMLX Diagram editor
As an alternative to the common coding approach, you can also make use of the diagram editor. It goes as an auxiliary tool to our diagram library with three modes of operation (default, org chart, mind map). By embedding the editor into your app, you will enable end-users to build flowcharts and other types of diagrams using 30+ built-in shapes in a code-free way. It has a user-friendly interface with drag-and-drop support consisting of four main parts:
- toolbar for controlling the whole editing process,
- left panel for choosing required shapes,
- grid area for interacting with shapes,
- right panel for changing the appearance of the diagram.
In terms of functionality, the editor supports the main features of the diagram component such as auto layout algorithm, custom shapes, swimlines, inline editing, etc. For convenient working with custom shapes, you can customize both panels of the editor.
Apart from that, the editor also provides some unique features. For example, it is possible to select multiple shapes and simultaneously perform some basic operations (drag, copy, paste, delete), set custom toolbars for shapes, speed up styling of similar shapes using special hotkey combinations, and more.
In addition to the auto layout algorithm, end-users are able to accurately organize shapes in the editor using snap lines and multiple alignment and distribution options.
These and other peculiarities of our diagram editor are fully covered in the documentation.
Conclusion
With DHTMLX Diagram, you get a great variety of features for visualizing processes of any complexity via a JavaScript flowchart. This type of diagram can reflect any interrelated facts in a consistent structure. You can apply it to illustrate whatever you need and get a very descriptive and intuitive visualization.
We do hope that our article will help you to take in the peculiarities of flowcharts and create your own JavaScript process flow diagrams with DHTMLX.
Our documentation provides developers with more details of how to build flowcharts as well as other diagram types included in the DHTMLX Diagram library.
If you’d like to give javascript flow diagrams a try now, just download our 30-day trial version.
Find more diagram types on the DHTMLX JavaScript Diagram page and contact us if you have any questions.