Since the 1910s when the Gantt Chart was initially devised, it has undergone many changes. Different types of projects, relationships between the tasks, and possible unexpectedness that you should be prepared while managing the working process, have led to the creation of more and more new custom elements, tricks, and approaches.
Download dhtmlxGantt – JavaScript Gantt Chart
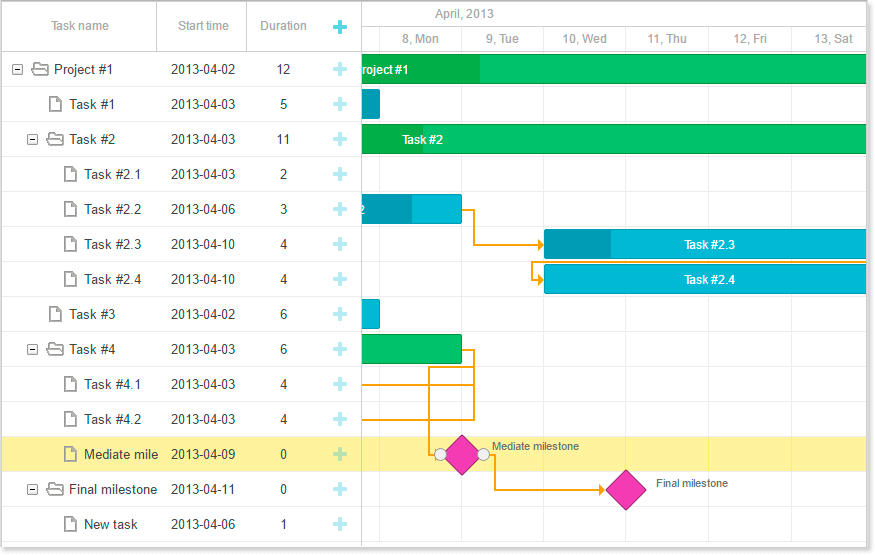
One of the simplest examples of such elements is a Milestone, a mark that shows an important part of the project.
For example, the milestone can show the moment when one of the important phases of the project such as design is finished. It helps define the most important dates at first sight. Moreover, completing a milestone is also a great achievement from a psychological point of view since it gives your team a great sense of accomplishment.
In this article, we’ll describe two types of custom elements that you can build with our js/html Gantt Chart: Deadlines and Baselines.
Note: dhtmlxGantt functionality is not limited to these two types of custom elements. In this blog post we use them as an example. Also, they can be designed based on your needs.
Using Deadlines
Without a doubt, meeting your deadlines is one of the key indicators that shows how well the work on the project goes. Missing your deadlines means additional losses and questions your ability to manage the working process successfully. Thus, it’s pretty important always to keep in mind your deadlines or, what’s even better, see them before your eyes. It’s an easy way to alert some possible problems in your schedule. But sometimes deadlines can be overlooked.
Starting from version 3.0, dhtmlxGantt allows you to add custom elements such as deadlines to your apps. Deadline dates are displayed next to each task, and if a task lasts too long and overlaps a deadline marker, you’ll see a notification icon in the list of tasks at the right side of the app. Here’s how it can look like:
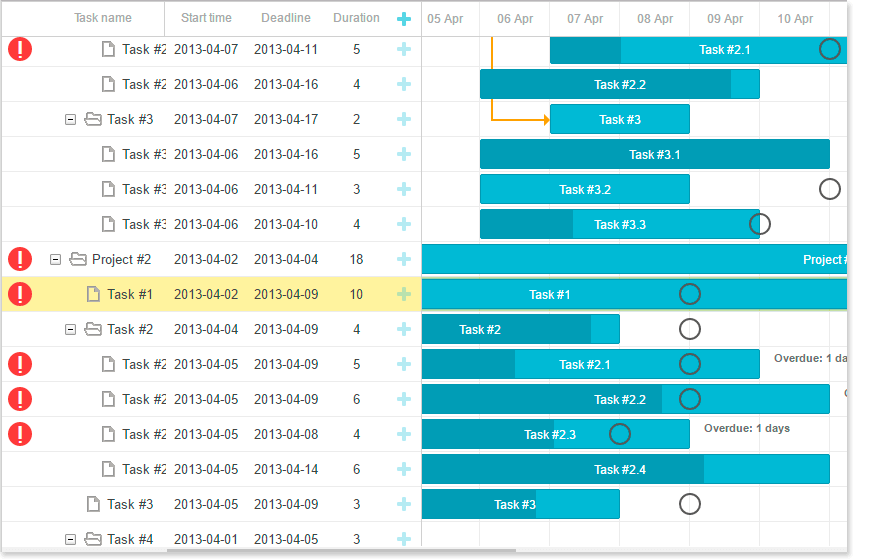
To check how it works, you can visit this demo page. If you change the duration of a proper task, you’ll see that a notification icon appears or disappears.
In dhtmlxGantt, displaying additional elements, such as a deadline or baseline, is usually done by creating a displayable layer and placing custom elements there. To add one more layer to the timeline area, use theaddTaskLayer method. As a parameter, the method takes a function that takes a task’s object and returns a DOM element that will be displayed or false.
Here’s an example of how you can use this method in case you want to add deadlines to your project:
gantt.addTaskLayer(function draw_deadline(task) {
if (task.deadline) {
var el = document.createElement('div');
el.className = 'deadline';
var sizes = gantt.getTaskPosition(task, task.deadline);
el.style.left = sizes.left + 'px';
el.style.top = sizes.top + 'px';
el.setAttribute('title', gantt.templates.task_date(task.deadline));
return el;
}
return false;
});
Here’s how everything works. After you call the method, dhtmlxGantt adds a container to the timeline area and calls addTaskLayer method for each task. The returned DOM element will be appended to the container. When a task is updated, the custom layers will be updated as well.
To learn more about displaying additional elements in the timeline area, check the following documentation page.
Using Baselines
First of all, let’s define what a baseline is and what are the possible reasons to use it in the chart. You can think of the baseline as an original plan of the project that can be used by a project manager to compare it to the actual state of affairs. As a result, you’ll be able to understand if the initial understanding of the project was right and how effective were the chosen approaches.
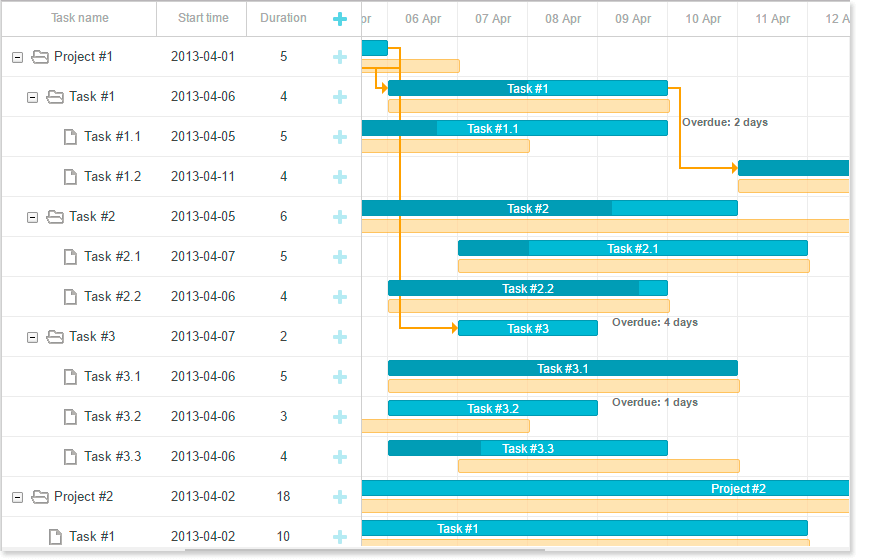
The baseline is a snapshot of your project at a given time. To better monitor the progress of a project, you can create more than one baselines. Those timeline projections could be compared to the actual timeline of a project to define the activities that were delayed, completed ahead of schedule, or performed on time. Such approach allows learning from the previous experience and developing a new strategy of scheduling.
To see how baselines can look in dhtmlxGantt, check this demo page.
The process of creation of the baselines in case of dhtmlxGantt consists of several tasks. We assume that you already know how to create a Gantt chart. If not, follow our guides.
To add a baseline to the existing chart, you should free some space under the task bar from the baseline first:
gantt.config.row_height = 40;
Then, move task line to the top of the row using the following code:
margin-top: -9px;
}
.gantt_side_content {
margin-bottom: 7px;
}
.gantt_task_link .gantt_link_arrow {
margin-top: -12px
}
.gantt_side_content.gantt_right {
bottom: 0;
}
After that, you need to add additional data properties to the task object. They’ll to the start and end values of the snapshot. For, example, planned_start, and planned_end.
dhtmlxGantt automatically parse the start_date and end_date data properties to Date objects. Any other date properties require additional processing. To make the recently added planned_start and planned_endproperties recognizable by dhtmlxGantt, we should parse them to Date objects using the parseDate() method within the onTaskLoading event handler:
task.planned_start = gantt.date.parseDate(task.planned_start, "xml_date");
task.planned_end = gantt.date.parseDate(task.planned_end, "xml_date");
return true;
});
Now, we should call the addTaskLayer method to display planned time for tasks:
if (task.planned_start && task.planned_end) {
var sizes = gantt.getTaskPosition(task, task.planned_start, task.planned_end);
var el = document.createElement('div');
el.className = 'baseline';
el.style.left = sizes.left + 'px';
el.style.width = sizes.width + 'px';
el.style.top = sizes.top + gantt.config.task_height + 13 + 'px';
return el;
}
return false;
});
Next, choose how your baselines will look like by using some CSS code:
position: absolute;
border-radius: 2px;
opacity: 0.6;
margin-top: -7px;
height: 12px;
background: #ffd180;
border: 1px solid rgb(255,153,0);
}
And, finally redefine the Lightbox structure if you want to provide a possibility to edit the newly added properties from UI:
{name: "description", height: 70, map_to: "text", type: "textarea", focus: true},
{name: "time", height: 72, map_to: "auto", type: "duration"},
{name: "baseline", height: 72, map_to: {
start_date: "planned_start", end_date: "planned_end"}, type: "duration"}
];
gantt.locale.labels.section_baseline = "Planned";
For more detailed information you can check the documentation page.

That’s it for today. We hope you find these new features handy and they’ll help you to improve the management process. To learn more about how customizing of the Gantt Chart can help with your work, you can check some of our recent posts. For example, What Is Critical Path Method or Leads and Lags.