We continue exploring the PRO features of DHTMLX Gantt and sharing with you some curious details that can be helpful in project management applications.
Our HTML5 Gantt chart component is loved for its enhanced customization capabilities. A basic Gantt chart timeline commonly includes tasks and dependency links between them. But an extensive API of our component helps to make the Gantt chart more informative for end-users by complementing its timeline area with custom HTML content.
In this post, we will review vivid examples of how to create custom baselines, highlight overdue tasks, and display task progress value in the Gantt timeline.
Use cases of custom content in Gantt timeline
When it comes to integrating custom items in Gantt charts built with DHTMLX, it is necessary to create a layer and then embed the required content in it. Our Gantt component offers the addTaskLayer method for displaying custom elements such as baselines or deadlines in the timeline area. Moreover, there is the overlay extension that can be used with any third-party library for generating custom content on top of the Gantt chart. More technical details on utilizing both these approaches can be found in the documentation. But we will focus on examples implemented with the addTaskLayer method.
Custom baselines
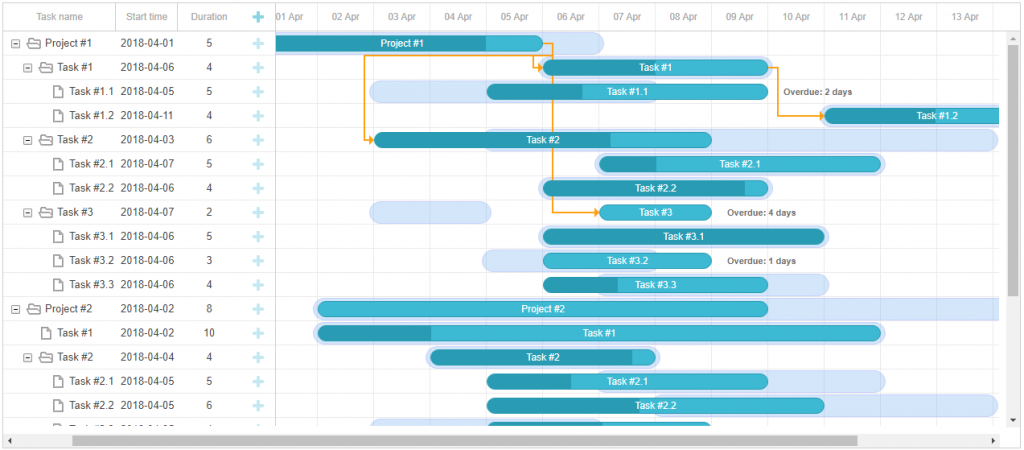
The need to display custom baselines (or deadlines) is one of the most common examples of using extra layers with DHTMLX Gantt. The image below shows good-looking custom baselines added in the Gantt timeline.
 Check the sample >
In this example, baselines are positioned vertically as well as tasks. By default, elements of the extra layer will be placed behind tasks (it can be changed with styles, but in our example, it is not necessary).
You have to use the getTaskPosition method to obtain the coordinates where custom items (baselines) should be drawn. Here you need to specify the task object and 2 dates (start and end dates of the baseline element). The appearance of baselines and coordinates are defined using styles.
if (task.planned_start && task.planned_end) {
var sizes = gantt.getTaskPosition(task, task.planned_start, task.planned_end);
var el = document.createElement('div');
el.className = 'baseline';
el.style.left = sizes.left - 6 + 'px';
el.style.width = sizes.width + 10 + 'px';
el.style.height = sizes.height + 6 + 'px';
el.style.top = sizes.top + 1 + 'px';
return el;
}
return false;
});
<style>
.baseline {
position: absolute;
border-radius: 2px;
z-index:0;
opacity: 0.3;
background: #6dadf0;
border: 1px solid #4a6bf8;
}
.gantt_task_line,
.baseline{
border-radius:20px;
}
</style>
That’s how you can generate custom baselines using the getTaskPosition method and add them to the Gantt timeline.
Highlighting overdue tasks
In real projects, tasks are frequently rescheduled causing time lags relative to the initial baselines and deadlines. End-users should be informed about such issues. For this purpose, you can come up with different custom solutions.
 Check the sample >
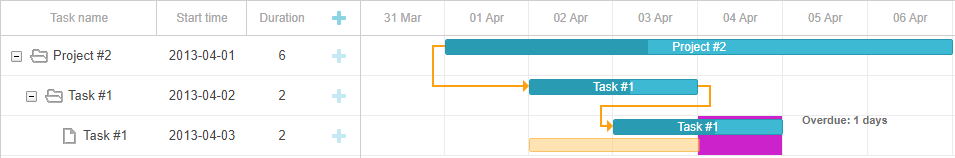
For instance, you can highlight cells in the timeline where the task duration exceeds the related baseline/deadline. In the presented example, the baseline is drawn in a simpler way (compared to other examples reviewed in this article) and cells are highlighted with the help of the task_cell_class template:
if (item.planned_end) {
if (item.end_date >= item.planned_end && date >= item.planned_end && date < item.end_date) {
return "overdue_cell"
}
}
};
The template will be called for each timeline cell (and for each task row). First, make sure that the task for the timeline row has the deadline date. Then check two conditions:
- the task ends later than it was planned (the task’s end date is greater than the deadline date)
- the cell starts after the deadline but before the task ends (the cell’s date is greater than the deadline date and lower than the task’s end_date)
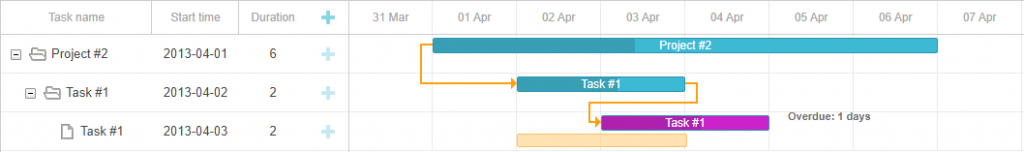
In addition, you can also make use of the rightside_text template and apply the same approach in it. If the task end date exceeds the deadline, estimate how many days it exceeds the planned end date and return this value with the text `Overdue`:
if (task.planned_end) {
if (end.getTime() > task.planned_end.getTime()) {
var overdue = Math.ceil(Math.abs((end.getTime() - task.planned_end.getTime()) / (24 * 60 * 60 * 1000)));
var text = "<b>Overdue: " + overdue + " days</b>";
return text;
}
}
};
It is also possible to change the color of tasks with an overdue status. You can check the dates of tasks in the task_class template and return the class name for tasks that are completed later than planned. The appearance of such tasks is fully customizable via styles.
if (task.planned_end) {
var classes = ['has-baseline'];
if (end.getTime() > task.planned_end.getTime()) {
classes.push('overdue');
}
return classes.join(' ');
}
};
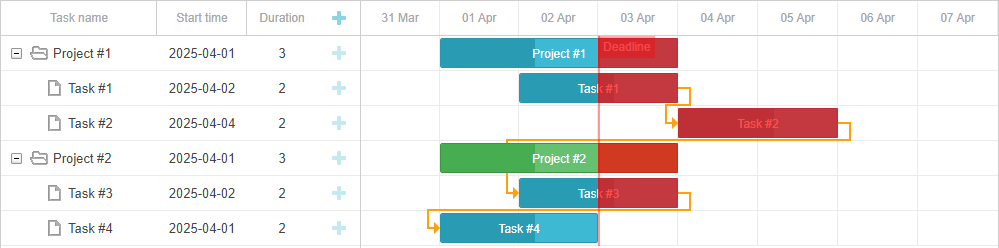
In previous examples, we have worked with deadlines for individual tasks. But what about showing the missed deadline for the whole project? To that end, we utilize the Marker extension to display a deadline.
 Check the sample >
marker: true
});
var deadline = new Date(2025,03,03);
var todayMarker = gantt.addMarker({
start_date: deadline,
css: "today",
text: "Deadline"
});
The logic for elements in the extra layer is the following. First of all, it is necessary to check if the task duration exceeds the deadline. If so, you have to set the deadline date for the left date (start date) of the extra layer element. But our goal here is to highlight the whole task if it exceeds the deadline date, rather than the area from the deadline to the end date of the task. If the task starts before the deadline and ends after it, we highlight the part of the task. If the task starts after the deadline, the whole task should be highlighted. Therefore, if the start date of the task is greater than the deadline, then the start date of the task becomes the left date of the deadline element. The right date (end-date) of the deadline element will be the end date of the task. Coordinates for the deadline element are obtained via the getTaskPosition method. After that styles are added.
var start_date = deadline;
if (+task.start_date > +deadline) start_date = task.start_date;
var sizes = gantt.getTaskPosition(task, start_date, task.end_date);
In this example, we have reviewed several helpful ways of highlighting tasks that do not meet time constraints specified in baselines and deadlines.
Task progress value
It can also be useful for end-users to be able to see the progress value of any project task and change it on the fly.
 Check the sample >
By default, the progress value of tasks is not displayed in the Gantt chart. It is possible to display it in the grid by adding a custom column. But it can be inconvenient for users to follow this parameter in the grid when visual changes take place in the timeline. Thus, it is more reasonable to apply an additional layer for depicting the progress value in the timeline. Using the getTaskPosition method get the coordinates of the task and then add a margin for the left parameter. In the styles add the z-index parameter to display a custom progress element on top of a given task.
var el = document.createElement('div');
el.className = 'progress_value';
el.innerHTML = Math.round(task.progress *100) +"%";
el.style.left = sizes.left + (sizes.width / 3) + 'px';
el.style.top = sizes.top + 'px';
return el;
If you want the element to be displayed only for the task with changing progress, you first need to get an ID for this task with the help of gantt.getState().drag_id and compare IDs of the tasks when creating an extra layer.
if (gantt.getState().drag_id == task.id) {
<..>
}
return false;
});
By following these instructions, you can visualize the progress values of project tasks and edit this parameter in real-time.
Conclusion
Summarizing the above, we can say that DHTMLX Gantt provides plenty of options for using custom HTML content in the Gantt timeline. Multiple interactive examples reviewed in this article show how you can benefit from the full customizability of our Gantt library in real-case scenarios.
Want to test the gained knowledge in your own project? Just download a free 30-day evaluation version of our JavaScript Gantt component and get down to it.
Next time we will share with you more complex examples on utilizing custom content in DHTMLX-based Gantt charts that will require extra code modifications. Stay tuned.