Updated on September 12, 2022
When dealing with a variety of tasks in your project, it is important to have a reliable tool that helps planning their timely execution. The Eisenhower Matrix is a viable option for such tasks and you can build it with our JavaScript diagram library.
In this blog post, we’ll explain the specifics of the Eisenhower Matrix and provide a step-by-step guide on how to create it without any code manipulations using the DHTMLX Diagram editor.
What is Eisenhower Matrix and How it Works
Dwight Eisenhower is a significant figure in American history, who achieved the highest ranks in his military and political career thanks in large part to his enviable level of efficiency at work. He was known for his highly efficient time management principles. Mr. Eisenhower once said that most things which are urgent are not important, and most things that are important are not urgent. These words became a foundation for a new technique called the Eisenhower Matrix (or Eisenhower Box).
It is a graphical diagram designed for arranging and prioritizing tasks on the basis of their urgency and importance. Combinations of these core parameters form the structure of the Eisenhower Matrix i.e. four categories (quadrants) for dividing tasks:
- Important and urgent – tasks with known deadlines that have to be timely completed to avoid any repercussions;
- Important but not urgent – tasks without a clear due date that should be scheduled for attaining your objectives in the future;
- Not important but urgent – tasks that must be done but do not require your personal attention and it is possible to delegate them to your colleagues;
- Not important and not urgent – time-wasting activities that can be neglected or even excluded from your workflow.
This kind of diagram is widely used by business analysts, product and project managers, team leaders, and ordinary employees to classify their day-to-day activities. People love this approach for its simplicity and straightforwardness. Therefore, it is nice to have an instrument that helps to incorporate this functionality into a web app with minimum time and effort.
JavaScript Eisenhower Matrix Example by DHTMLX
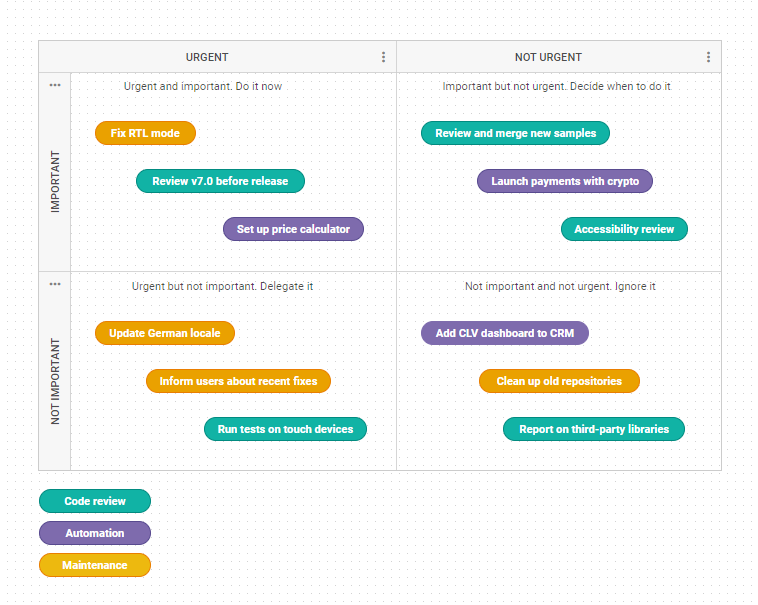
Our example provides a basic scenario of using the Eisenhower Decision Matrix to facilitate the workflow of a product team. Utilizing the task priority principle of this approach, we arranged tasks in four quadrants for three different product management stages: code review, automation, and maintenance. Each type of task is labeled with different colors to present the tasks’ prioritization in a more visually compelling and understandable way. As you can see, we also added clarification remarks for each category of the box that remind users how tasks should be handled.
Creating a JavaScript Eisenhower Matrix with DHTMLX Diagram Editor
Alternatively to a common coding approach, you can use the default mode of the DHTMLX Diagram editor for building an Eisenhower Matrix on the fly. This mode is initialized by invoking the dhx.DiagramEditor constructor and setting the “default” type in the configuration object:
type: "default"
});
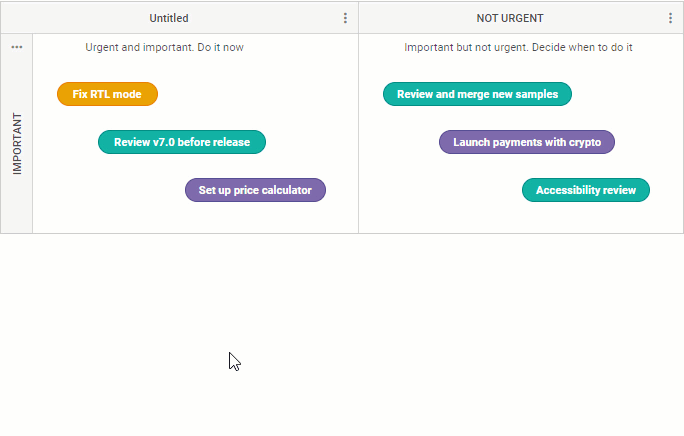
The default mode of the JavaScript editor comes with a user-friendly UI, including four sections: header toolbar, grid area, and two side panels. It includes everything you need for creating a basic Eisenhower Priority Matrix.
Open our example in your browser and let us consider the main capabilities of the DHTMLX JavaScript editor in more detail.
- Adding and manipulating matrix elements
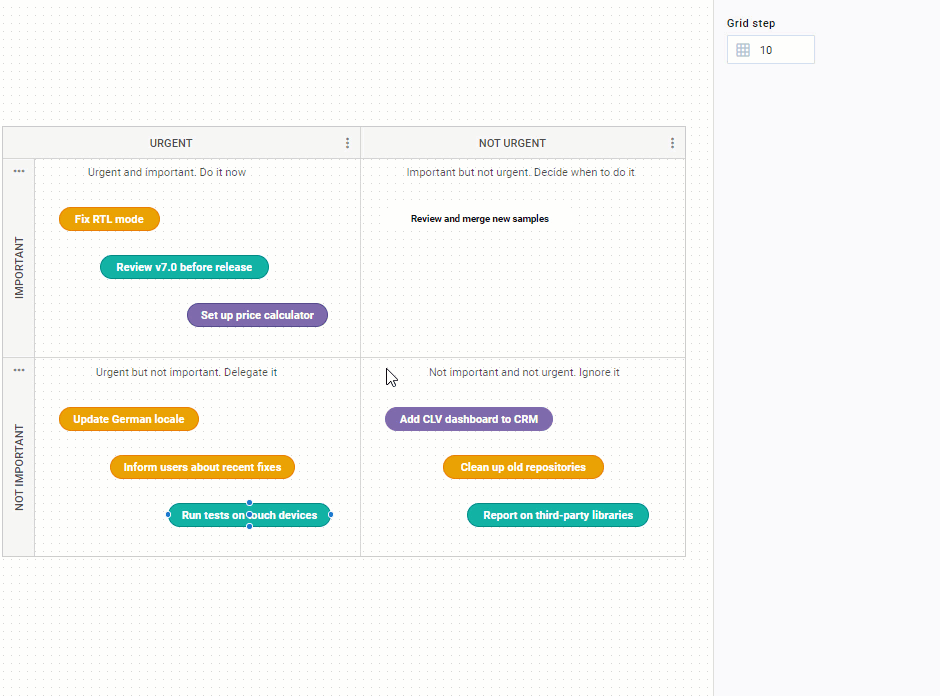
Using the drag-and-drop interface, you can choose all necessary shapes and visual elements listed in the left panel and place them in the grid area. You can specify the core structure of the Eisenhower Box using any built-in swimlane template. It is easy to adjust swimlanes using a context (3-dot) menu.
All swimlane text labels are made via inline editing. Tasks and other clarifying textual content can be added with the help of built-in topic shapes. Each shape has a personal toolbar with a pack of basic editing operations (copy, add a connector, delete). Thus, you can use the copy option to save time on adding similar shapes but pay attention that this option is unavailable inside the swimlane. Moreover, it is possible to quickly and accurately position shapes in relation to one another using snap lines that appear when the coordinates of the dragged and static shapes match up.

- Fine-tuning the appearance of matrix elements
When it comes to ensuring a unique look for your Eisenhower Matrix, you can find all editing options in the right-side panel. All you have to do is to click on the needed shape and you’ll get access to necessary settings. Here you can play around with all available parameters for any diagram element: dimensions, stroke, color, text, and text styling.
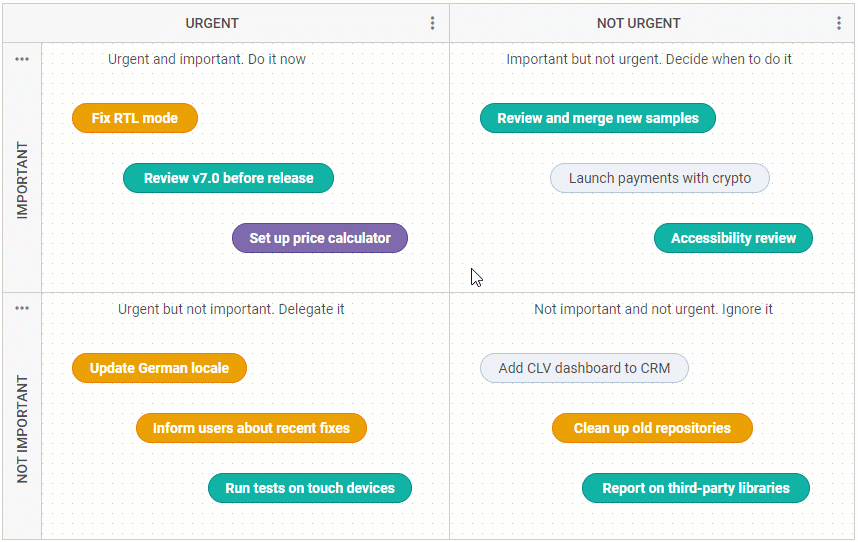
At the same time, there is a much faster way to style shapes that should look the same. You can use hotkey combinations to copy (ALT+CTRL(Cmd)+С) the style settings of the selected shape and paste (ALT + CTRL (CMD) + V) them into the target shapes.
- Exporting and importing in JSON
When your Eisenhower Matrix is completed, you can apply the exporting option given in the toolbar to save the result in the JSON format. You can use the exported file to populate DHTMLX Diagram with the Eisenhower Matrix data and use it in your application. It is also very convenient to import the JSON file back into the JavaScript editor and continue polishing the matrix.
That’s how you can use the DHTMLX Diagram editor for building your own Eisenhower Matrix.
Conclusion
The DHTMLX-based Eisenhower Matrix is a great addition to any toolset that serves for enhancing productivity and avoiding serious miscalculations in task planning. But if your needs exceed the capabilities provided in our JavaScript editor, that is not a reason to get frustrated. You can always use an extensive API provided in our JavaScript diagramming library to customize the editor for achieving any data visualization goals. For instance, you can add custom shapes to the editor and adjust both side panels for convenient working. If you are in two minds about using DHTMLX Diagram in your JavaScript project, you can test it absolutely free of charge by downloading a 30-day evaluation version.
Related Materials:
- How to Create a JavaScript Mindmap Diagram with DHTMLX Library
- How to Create a Data Flow Diagram in JavaScript with DHTMLX
- How to Create a Basic JavaScript Entity Relationship Diagram with DHTMLX
- How to Create a JavaScript Tree Diagram with DHTMLX
- How to Create a JavaScript Network Diagram with DHTMLX
- How to Create a JavaScript UML Class Diagram with DHTMLX