Welcome back to our series of posts on how to boost your data visualization capabilities with the DHTMLX Diagram. The collection of diagrams included in our library has recently received a new addition – a JavaScript mind map. In this article, you will get some general insights into mind maps and learn how to build them with DHTMLX in two different ways.
What is a mind map
A mind map is a type of diagram that provides a simple but effective way to hierarchically present ideas and concepts of any complexity. This visualization tool is based on radiant thinking. It means that a key concept is placed at the center of the diagram and associated ideas branch off from it in different directions using curvy connectors, specifying relationships between them. Thus, you can break down complex ideas into smaller chunks of information and describe them in greater depth. It is also common to highlight groups of ideas in mind maps with different colors and add some related images, thereby stimulating a better perception and memorization of the “mapped” information.
The concept of mind mapping was brought into the mainstream by the British psychologist Tony Buzan in the late 1960s. Since then, it has become a popular approach to organizing thoughts more productively and avoid information overloads in different kinds of activities such as:
- Learning techniques
- Personal knowledge management
- Project planning
- Decision making
- Brainstorming
- Note-taking
JavaScript mindmap example by DHTMLX
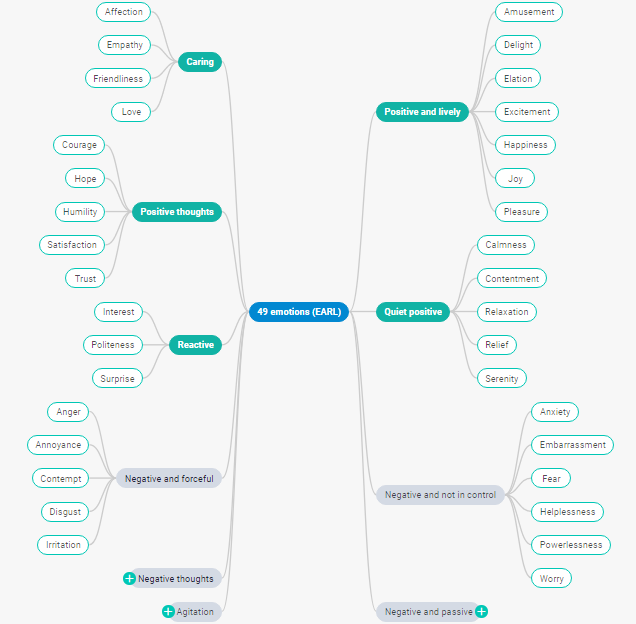
Our example shows the mind map of the classification of human emotions designed by the HUMAINE association. Dubbed as EARL (emotional annotation and representation language), it is intended to help tech specialists develop interactive emotion-oriented systems (affective computing).
This classification includes several groups of emotions and the mind mapping approach suits perfectly for its visual presentation. It has a standard two-dimensional structure, where the root shape with the name of the classification is positioned in the middle, ten categories of emotions stem from it in opposite directions, and actual emotion types emanating from these groups. DHTMLX Diagram comes with special oval shapes (named as topic shapes) for displaying mind map elements and curvilinear connectors for linking them with each other. Groups of positive emotions are depicted in green, while groups of negative emotions are shown in grey to make the diagram more visually appealing and comprehensible.
Starting from v3.1, our Diagram library enables you to create mind maps using a traditional coding approach or via a newly-made DHTMLX mind map editor without any code manipulations at all. Let us explore both of these options in more detail.
How to create a JavaScript mindmap with DHTMLX library
We start with highlighting key aspects of how to build your own DHTMLX mind map of the EARL classification by writing code. We will also pay special attention to the available positioning options for child shapes in relation to the root shape and the possibility to show or hide a specific branch of the diagram.
1) Example of creating a basic DHTMLX mindmap:
type: "mindmap",
});
diagram.data.parse(data);
The necessary type of the diagram is specified with the type:”mindmap” property in the configuration object. More details on the initialization process can be found in the documentation.
2) Placing child shapes in one direction
type: "mindmap",
typeConfig: {
direction: "right",
},
});
diagram.data.parse(data);
Check the sample >
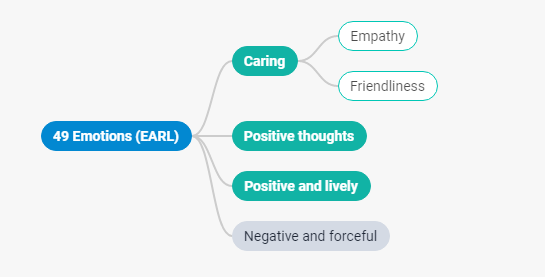
When it comes to positioning mind map branches in your own way, our library provides a typeConfig property with two attributes (direction and side). If it is necessary to set child shapes on one side (left or right), we apply the direction attribute.
3) Placing child shapes in both directions
type: "mindmap",
typeConfig: {
side: {
left: ["caring", "positiveThoughts"],
right: ["negativeAndForceful", "positiveAndLively"],
},
},
});
diagram.data.parse(data);
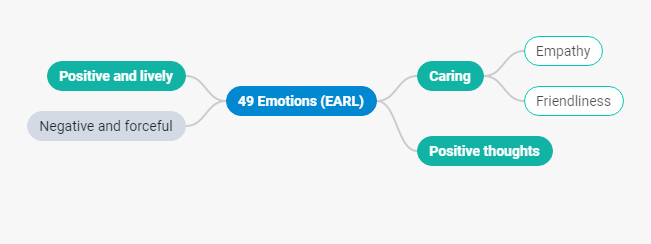
The side attribute allows arranging child shapes in both left and right directions. For this purpose, we label these shapes with identification names in the corresponding side option.
Both attributes of the typeConfig property are optional. If none of them is used, child shapes in the mind map will be positioned automatically.
4) Showing/hiding mindmap child shapes
{
id: "emotionsEarl",
text: "49 Emotions (EARL)",
"fill": "#0288D1",
"fontColor": "#FFFFFF",
"stroke": "#0288D1",
"fontWeight": "bold",
openDir: {
left: true,
right: false,
}
}
…
];
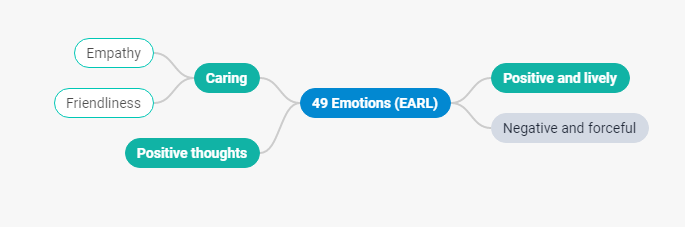
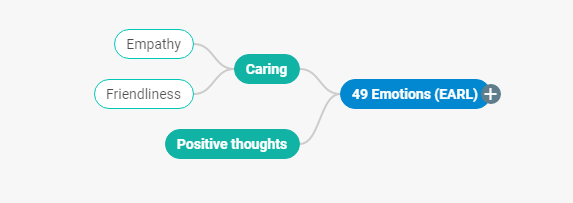
Another useful feature is the possibility to show or hide specific child shapes that branch off from the root shape in the right or left side. To do that, you have to make use of the openDir attribute during the configuration process. In our example, child shapes to the right of the parent shape are collapsed, while shapes on the left stay visible.
Creating JavaScript mindmaps with DHTMLX mind map editor
The DHTMLX mind map editor is a new tool for generating mind maps and editing them on the fly. In terms of functionality, this editor is similar to the DHTMLX editors for diagrams and org charts.
This type of editor can be initialized by calling the dhx.DiagramEditor and specifying the “mindmap” type in the configuration object.
type: "mindmap"
});
Data is loaded in the editor via the parse method.
A comprehensive API provides a variety of configuration properties allowing you to adjust the mind map editor to specific requirements of your project.
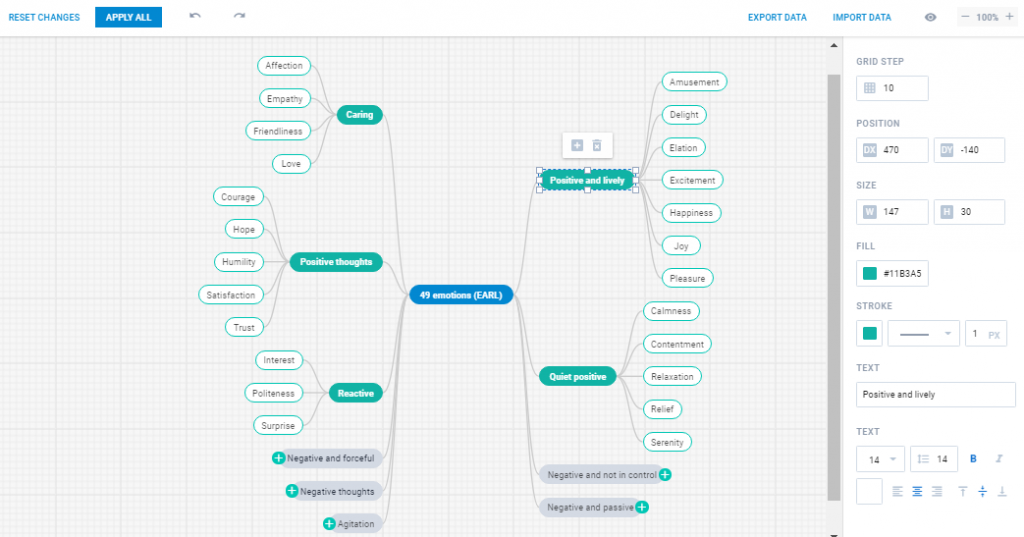
The editor has a user-friendly interface composed of three main parts: header toolbar, grid area, and right-side editing panel.
Utilize this snippet to try out different things with our example in the editor
Let us become familiar with what you can do once the mind map is loaded in the editor.
- Manipulating and modifying any mind map elements via UI
The editor has a drag-and-drop interface, therefore you can easily change the position of any mind map shape relative to the root shape. If you need to move around the whole diagram, just drag the root shape in the required direction.
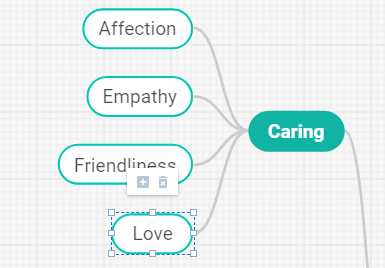
It is possible to perform some editing operations via a personal toolbar of any mind map shape. When you click on a particular shape, the appeared toolbar enables you to add a child shape and resize or delete the selected shape.
You can also simultaneously select several shapes with a mouse (or a hotkey combination – Shift+Left Click) and drag or delete them.
If you need more editing capabilities in the per-shape toolbar, you can add custom options by using the shapeToolbar property.
- Editing shape attributes with the help of the right-side panel
This editing panel offers plenty of options for tuning the visual appearance of the mind map shapes. After clicking on a specific shape, you will be able to accurately set the size and arrangement of the shape, change its color scheme, and make adjustments to how text is displayed.
- Exporting/importing options for JavaScript mind maps
It is also possible to work with DHTMLX-based mind maps offline, as our library supports exporting to popular formats (PDF, PNG, JSON). If something has to be reworked, it is not a problem to import the diagram back into the editor.
That’s how you can handle a JavaScript mind map visualization in the DHTMLX mind map editor.
Conclusion
In this article, we’ve examined two ways of using our JavaScript Diagram library for visualizing ideas with mindmaps. It can be done with just a few lines of code or via the mind map editor. As a cherry on top, now you can also take advantage of the TypeScript support to start diagramming with DHTMLX more promptly and efficiently.
But as is often said: first try and then trust. Make use of a free 30-day evaluation version of our library to see how it works in your own scenarios.