Updated on March 19, 2026
JavaScript developers often need to create UML class diagrams to design application architecture, visualize class relationships, and document complex systems. However, many UML tools are either too complex, poorly documented, or hard to integrate into modern web applications.
In this step-by-step tutorial, you’ll learn how to create an interactive UML class diagram in JavaScript using DHTMLX. We’ll cover the full implementation process, show working code examples, and explain best practices for building scalable UML diagrams for real-world projects.
What is a UML Class Diagram
UML class diagrams are mostly used in software engineering for modeling the static structure of applications. They help business analysts to analyze a business domain and depict core business elements, which lay the foundation for a future app. Prepared by business analysts UML class diagrams provide developers with a clear understanding of the whole system structure.
The class diagram is the only UML diagram type that can be mapped directly with object-oriented languages including JavaScript. These diagrams make things much easier for developers in complex projects. That is why this visualization tool is extremely popular in the dev community.
UML class diagrams illustrate the following key elements of a system:
- classes,
- class attributes,
- and relationships.
Example of a Basic JavaScript UML Class Diagram
Let’s look at the example of a simple JavaScript UML class diagram made with DHTMLX.
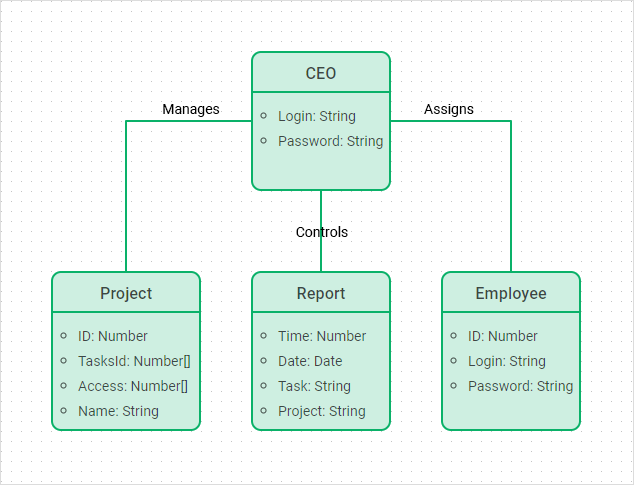
Our example shows the structure of a basic reporting system administered by a company’s CEO. It consists of four classes: CEO, Project, Report, and Employee. The CEO manages projects of a company, assigns employees, and controls their reports. Straight and right-angled lines show the association relationships between classes.
Each class comprises a set of attributes necessary for the correct functioning of the reporting system. The CEO class includes credentials to log into the system: login and password. The Project class should have an ID in a number format, a name in a text format, tasks with IDs, and access rights for employees defined by their IDs. The Report contains time and date when it is created as well as tasks and projects to be reported on. The employee has an ID and credentials: login and password.
Step-by-step Guide on How to Create a JavaScript UML Сlass Diagram with DHTMLX
Let’s walk through the whole process of creating a simple UML class diagram in JavaScript with DHTMLX.
Step 1. Initialize DHTMLX Diagram
<html>
<head>
<script type="text/javascript" src="codebase/diagram.js"></script>
<link rel="stylesheet" href="codebase/diagram.css">
</head>
<body>
<div id="diagram"></div>
<script>
const diagram = new dhx.Diagram("diagram");
</script>
</body>
</html>
At first, you need to add JS and CSS source files and a container to place a diagram on a page. Then you should use the dhx.Diagram constructor to initialize your diagram. The constructor has two parameters: container created at the very first step and object with configuration options.
Step 2. Define Default UML Shapes
title: "Title",
text: ["Text"],
height: 90,
width: 140,
fill: "#CEEFE1",
stroke: "#0AB169",
strokeWidth: 2
};
The defaults config can save you lots of time and lines of code when you specify the properties of diagram shapes. We have four similar UML class shapes colored in mint green with a 2px green stroke. All of them have a Title, which stands for the name of a class, and text, which describes class attributes. We may also set other options such as height and width commonly used in the configuration of shapes.
Step 3. Create a Custom UML Class Template
<section class='template'
style='
background:${config.fill};
border:${config.strokeWidth}px solid ${config.stroke}'>
<h3 style='border-bottom:${config.strokeWidth}px solid ${config.stroke}'>
${config.title}
</h3>
<ul>
<li>${config.text.join("</li><li>")}</li>
</ul>
</section>
`);
To create a UML class shape, you need to prepare an HTML template for it. We use the ES6+ format supported by modern browsers for the template of our shapes.
The template lets you specify all elements of the UML class shape: top part with a heading and bottom part with a list of attributes. You can also include style settings for the background and borders.
Step 4. Add Shapes to the UML Class Diagram:
template,
defaults
});
When we have our template for shapes and default configuration done, we can add shapes to our JavaScript UML class diagram via the addShape method. This method allows for adding any kind of shapes created with the help of templates.
Step 5. Prepare and Parse Data
// shapes
{
id: "s1",
type: "template",
title: "CEO",
text: ["Login: Text","Password: Text"],
fill: "#CEEFE1",
stroke: "#0AB169",
strokeWidth: 2,
x: 200, y: 0, width: 140, height: 140,
},
{
id: "s2",
type: "template",
title: "Report",
text:["Time: Number","Date: Date","Task: Text","Project: Text"],
fill: "#CEEFE1",
stroke: "#0AB169",
strokeWidth: 2,
x: 350, y: 220, width: 140, height: 160,
},
{
id: "s3",
type: "template",
title: "Employee",
text:["ID: Number","Login: Text","Password: Text"],
fill: "#CEEFE1",
stroke: "#0AB169",
strokeWidth: 2,
x: 540, y: 220, width: 140, height: 160,
},
{
id: "s4",
type: "template",
title: "Project",
text:["ID: Number","Access[]: Employee ID","Task[]: Task ID","Name: Text"],
fill: "#CEEFE1",
stroke: "#0AB169",
strokeWidth: 2,
x: 120, y: 220, width: 180, height: 160,
},
// connectors
{
type: "line",
stroke: "#0AB169",
connectType: "elbow",
from: "s1",
to: "s2",
fromSide: "bottom",
toSide: "top"
},
{
type: "line",
stroke: "#0AB169",
connectType: "elbow",
from: "s1",
to: "s4",
fromSide: "left",
toSide: "top"
},
{
type: "line",
stroke: "#0AB169",
connectType: "elbow",
from: "s1",
to: "s3",
fromSide: "right",
toSide: "top"
},
// text
{
type: "text",
fontColor: "rgba(0,0,0,0.70)",
lineHeight: "14",
fontSize: "14",
text: "Assigns",
textAlign: "center"
},
{
type: "text",
fontColor: "rgba(0,0,0,0.70)",
lineHeight: "14",
fontSize: "14",
text: "Manages",
textAlign: "center"
},
{
type: "text",
fontColor: "rgba(0,0,0,0.70)",
lineHeight: "14",
fontSize: "14",
text: "Coordinates",
textAlign: "center"
},
];
diagram.data.parse(fullHtmlData);
At this step, we prepare an entire dataset for shapes, connectors, and text elements to be loaded into our JavaScript UML class diagram. We specify the data for each shape in the JSON format. We use the parse method to load the prepared data.
Step 6. Style the UML Сlass Diagram:
.template {
height:100%;
border-radius: 10px;
overflow: hidden;
}
.template h3 {
text-align: center;
height: 40px;
line-height: 40px;
}
.template ul {
padding: 8px 5px 5px 5px;
}
.template li {
text-align: left;
list-style-type: circle;
margin: 5px 0 0 20px;
white-space: nowrap;
}
</style>
As a final touch, we can enhance the look and feel of our JS UML class diagram by specifying style attributes for its elements. We can define the border-radius, text-align, line-height, and other settings of UML class shapes.
Following these six steps, you have a basic JavaScript UML class diagram ready.
Visualizing application structures via UML class diagrams can be made much easier thanks to the availability of the DHTMLX Diagram Editor. Being an integral part of our core diagramming library, this out-of-the-box tool provides an interactive environment to create, modify, and visualize complex data structures without writing code. After geetting deeper insight into DHTMLX JavaScript Diagram Editor, you can play around with the UML class diagram template right in the editor and estimate the merits of this approach.
Check the full implementation in the Diagram Editor
const editor = new dhx.DiagramEditor(document.body, {
view: {
shapebar: {
sections: {
"UML": [{ type: "uml" }],
"Flow shapes": [{ flowShapes: true }],
}
},
editbar: {
properties: {
uml: [
{ type: "arrange" },
{
type: "fieldset",
label: "Description",
rows: [
{ type: "input", key: "title", label: "Title" },
{ type: "list", key: "text", label: "Text" },
],
},
{ type: "colorpicker", key: "fill", wrap: true, label: "Background color" },
{
type: "border",
$properties: {
strokeType: { hidden: true },
strokeWidth: { width: "80%" },
}
},
],
},
controls: {
list: {
type: "textarea",
$setValue: ({ control, value }) => {
control.setValue(value.join("\n"));
},
$handler: ({ id, key, value, editor }) => {
editor.diagram.data.update(id, {
[key]: value.split("\n"),
});
},
},
}
}
},
defaults: {
line: { stroke: "#0AB169" },
}
});
editor.diagram.addShape("uml", {
template: ({ fill, strokeWidth, stroke, text, title }) => (`
<section class="uml" style="background: ${fill}; border: ${strokeWidth}px solid ${stroke}">
<h3 style="border-bottom: ${strokeWidth}px solid ${stroke};">${title}</h3>
<ul>
<li>${text.join("</li><li>")}</li>
</ul>
</section>
`),
defaults: {
title: "Title", text: ["Text"],
fill: "#CEEFE1", stroke: "#0AB169", strokeWidth: 2
}
});
editor.parse(data);
Final words
DHTMLX JavaScript Diagram library enables developers to create JavaScript UML class diagrams as well as a wide variety of other diagram types in a few lines of code. You can easily add any custom shapes via HTML templates and specify the default configuration of shapes with just one property. DHTMLX offers a 30-day free trial version to evaluate the library and try it out in your projects.