It is high time to expand your arsenal of data visualization tools with one more diagram type that can be implemented with the DHTMLX Diagram library. We are willing to share with you a comprehensive guide on how to produce JavaScript tree diagrams. All you have to do is to download a trial version of our diagram library and adhere to detailed instructions that are provided in this post.
What is a Tree Diagram
A tree diagram is a widely used tool that allows graphically presenting various kinds of data in the hierarchical or tree-like structure. It commonly consists of tree elements (nodes) that are joined together with connection lines (branches), vividly illustrating parent-child relations between nodes. Using this type of diagram, you can enjoy a simple data representation concept, the possibility to easily trace dependencies between diagram elements, and clarity of the provided info.
Thanks to the combination of simplicity and high adaptability, JavaScript tree diagrams (also named as tree graphs) have gained popularity in various fields of application such as:
- Different areas of business management like staff management (org charts) or task management (WBS diagram)
- Computer science (tree data structure, decision tree)
- Mathematics (probability theory)
- Biology (evolutionary tree)
- Genealogy (family tree), and other traditional branches of knowledge.
JavaScript Family Tree
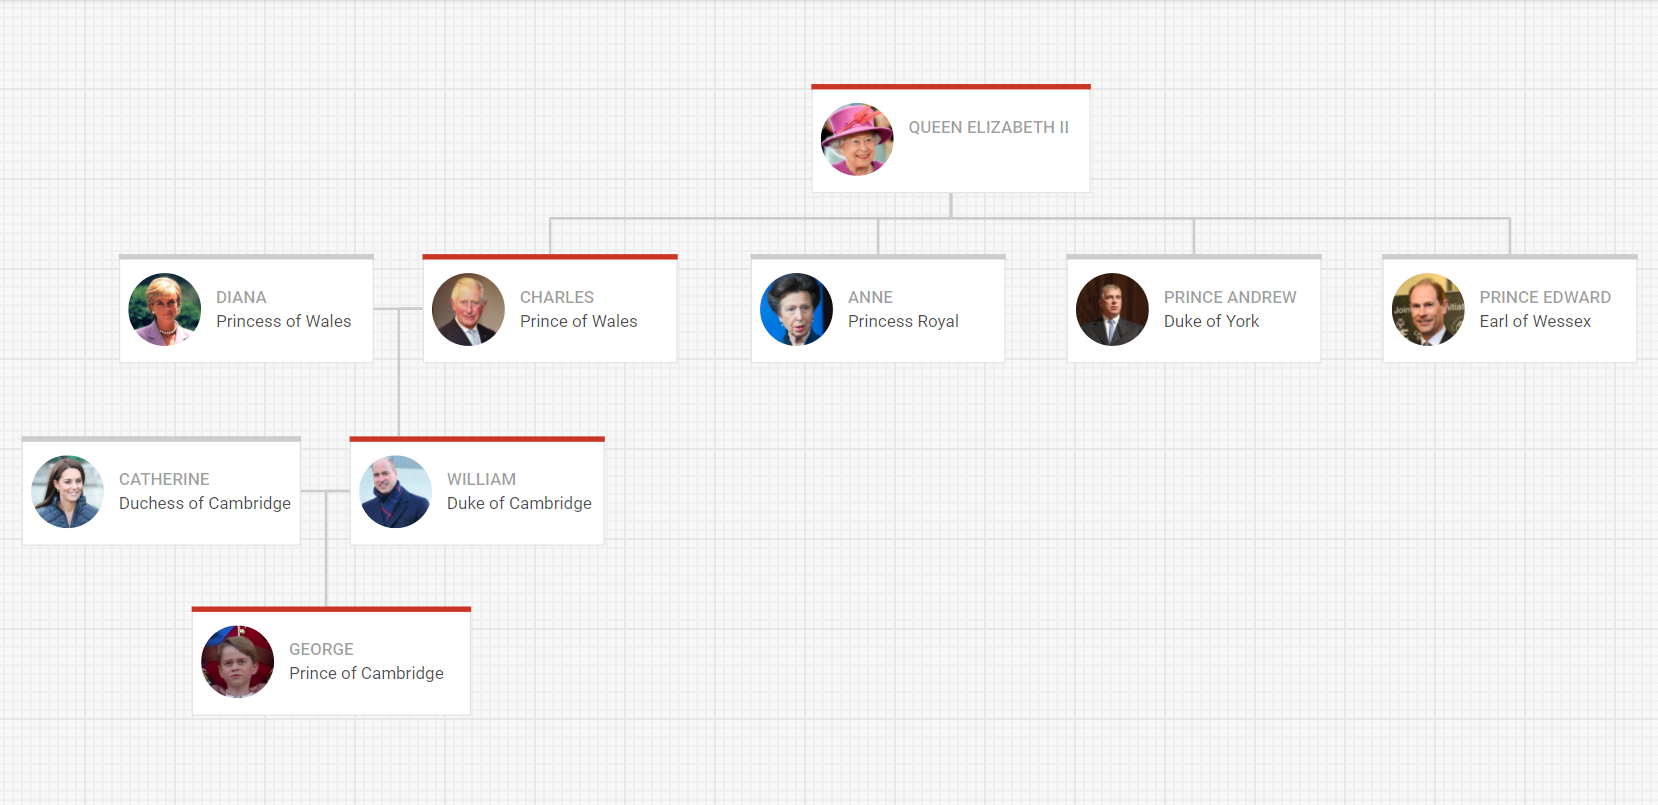
Apart from the widespread use in organizational hierarchies, tree diagrams are popular in genealogy for family tree visualization. A JavaScript family tree is a type of diagram intended for visually presenting kin relationships and generational bonds within a family. These diagrams can be utilized not only in academic disciplines like history or genealogy but also by ordinary people interested in their ancestry.
The example above depicts a part of the British royal family tree with the line of succession highlighted in red.
Example of a JavaScript Tree Diagram by DHTMLX
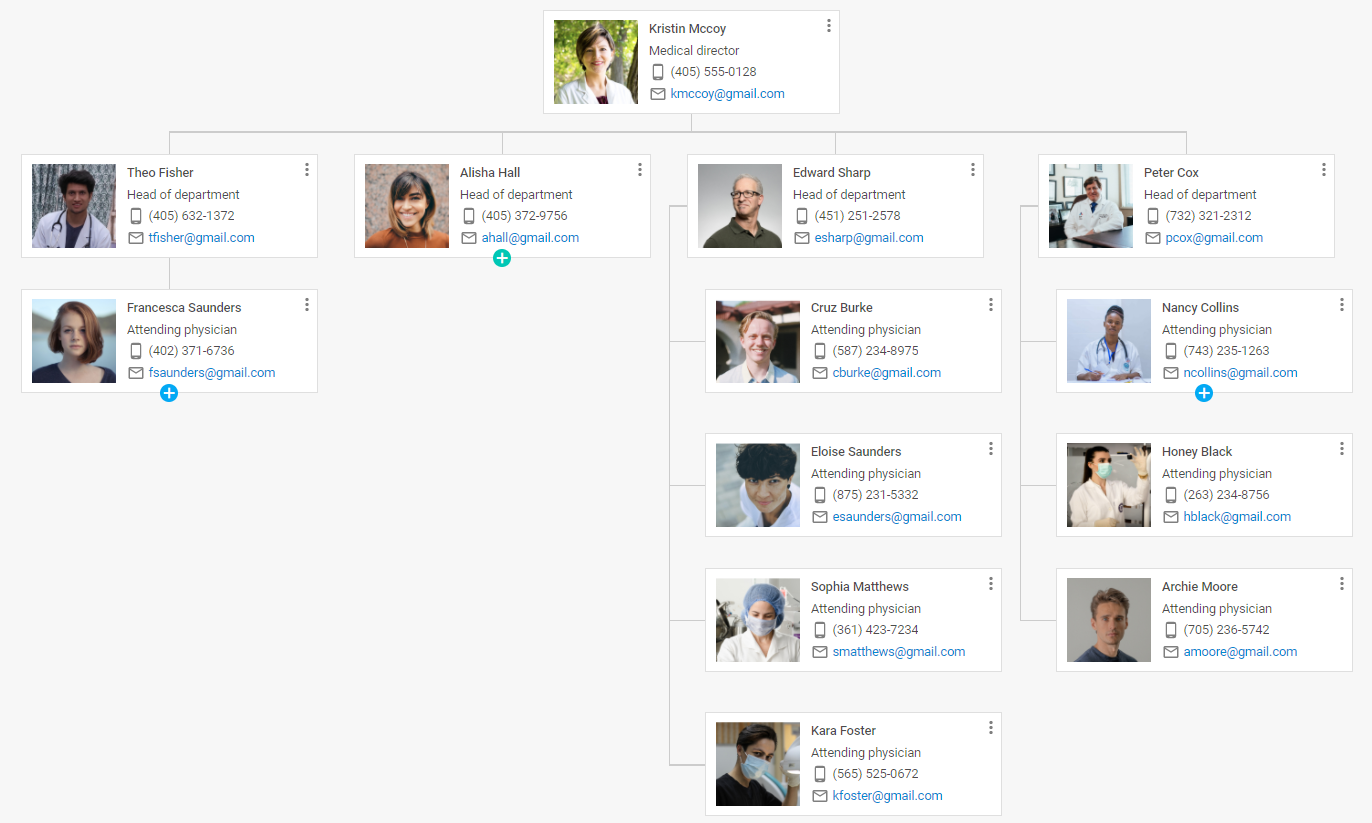
Let us have a closer look at the instance of a JavaScript tree diagram generated by the DHTMLX Diagram library.
The diagram above is an org chart, which showcases the hierarchical organizational structure of a medical institution. It comes with custom shapes that include visual and textual info about medical workers: a doctor’s photo, name, position, fields for contact information (phone number and email) as well as icons and labels.
Straight and orthogonal connectors (branches) demonstrate the staff reporting structure.
How to Create a JavaScript Tree Diagram with DHTMLX
Now we are going to gain insight into the sequence of actions performed with our JavaScript library for drawing tree diagrams like in the example above.
1. Initialize the JavaScript tree diagram:
<html>
<head>
<script type="text/javascript" src="codebase/diagram.js"></script>
<link rel="stylesheet" href="codebase/diagram.css">
<link href="https://cdn.materialdesignicons.com/4.5.95/css/materialdesignicons.min.css?v=3.0.2" media="all" rel="stylesheet" type="text/css">
</head>
<body>
<div id="diagram"></div>
<script>
const diagram = new dhx.Diagram("diagram", {
type: "org",
defaultShapeType: "template"
});
</script>
</body>
</html>
The first steps that must be taken before the initialization are the following:
- add DHTMLX Diagram JS and CSS source files
- create a container to embed your tree diagram into it
- add a CDN file with Material Design icons to be used in personal cards of medical workers
Then call the dhx.Diagram constructor to carry out the initialization of your tree diagram. The constructor function comes with two parameters: an already created container and an object with configuration properties. In the configuration object, you have to define the type:”org” property to create an org chart, which is a kind of a tree diagram for showing the organization hierarchy. Besides, you need to specify the type of diagram shapes via the defaultShapeType property.
2. Set the default configuration for diagram shapes:
height: 115,
width: 330
};
You can speed up the process of creating your JavaScript tree diagram from scratch by applying the defaults config. It enables you to set common characteristics of specific elements for all shapes at once. Our example of the tree diagram consists of 12 nodes with the same dimensions (115 x 330). So, we can specify the default height and width for them.
3. Create a template for custom shapes:
<div class="dhx-diagram-demo_personal-card">
<div class="dhx-diagram-demo_personal-card__container dhx-diagram-demo_personal-card__img-container">
<img src="${photo}" alt="${name}-${post}"></img>
</div>
<div class="dhx-diagram-demo_personal-card__container">
<h3>${name}</h3>
<p>${post}</p>
<span class="dhx-diagram-demo_personal-card__info">
<i class="mdi mdi-cellphone-android"></i>
<p>${phone}</p>
</span>
<span class="dhx-diagram-demo_personal-card__info">
<i class="mdi mdi-email-outline"></i>
<a href="mailto:${mail}" target="_blank">${mail}</a>
</span>
</div>
</div>
);
When it comes to the creation of a custom shape for your tree diagram, the first thing you should do is set up an HTML template for shapes. We apply the ES6+ standard for this purpose.You can define all required attributes of custom shapes via this template:
- photo of a medical worker
- doctor’s name and position
- phone icon from the package of Material design icons and phone number
- email icon and email address link
4. Add shapes to the tree diagram:
template,
defaults
});
The following step will be the addition of custom shapes to your JavaScript tree graph. It can be done with the addShape method. This simple method enables you to swiftly add various shapes utilizing templates and the default configuration of shapes.
5. Prepare and parse data into the diagram:
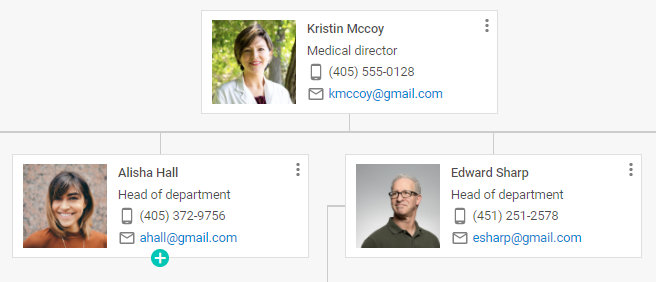
const data = [
{
id: "main",
name: "Kristin Mccoy",
post: "Medical director",
phone: "(405) 555-0128",
mail: "kmccoy@gmail.com",
photo: "https://docs.dhtmlx.com/diagram/samples/common/big_img/big-avatar-1.jpg",
},
{
id: "1",
name: "Theo Fisher",
post: "Head of department",
phone: "(405) 632-1372",
mail: "tfisher@gmail.com",
photo: "https://docs.dhtmlx.com/diagram/samples/common/big_img/big-avatar-2.jpg",
parent: "main"
},
{
id: "1.1",
name: "Francesca Saunders",
post: "Attending physician",
phone: "(402) 371-6736",
mail: "fsaunders@gmail.com",
photo: "https://docs.dhtmlx.com/diagram/samples/common/big_img/big-avatar-3.jpg",
parent: "1",
open: false
},
{
id: "2",
name: "Alisha Hall",
post: "Head of department",
phone: "(405) 372-9756",
mail: "ahall@gmail.com",
photo: "https://docs.dhtmlx.com/diagram/samples/common/big_img/big-avatar-4.jpg",
parent: "main",
open: false
},
{
id: "2.1",
name: "Milena Hunter",
post: "Attending physician",
phone: "(124) 622-1256",
mail: "mhunter@gmail.com",
photo: "https://docs.dhtmlx.com/diagram/samples/common/big_img/big-avatar-25.jpg",
parent: "2",
dir: "vertical",
},
{
id: "2.2",
name: "Maximus Dixon",
post: "Medical director",
phone: "(264) 684-4373",
mail: "mdixon@gmail.com",
photo: "https://docs.dhtmlx.com/diagram/samples/common/big_img/big-avatar-29.jpg",
parent: "2",
dir: "vertical",
},
{
id: "3",
name: "Edward Sharp",
post: "Head of department",
phone: "(451) 251-2578",
mail: "esharp@gmail.com",
photo: "https://docs.dhtmlx.com/diagram/samples/common/big_img/big-avatar-6.jpg",
parent: "main",
dir: "vertical",
},
{
id: "3.1",
name: "Cruz Burke",
post: "Attending physician",
phone: "(587) 234-8975",
mail: "cburke@gmail.com",
photo: "https://docs.dhtmlx.com/diagram/samples/common/big_img/big-avatar-7.jpg",
parent: "3",
},
{
id: "3.2",
name: "Eloise Saunders",
post: "Attending physician",
phone: "(875) 231-5332",
mail: "esaunders@gmail.com",
photo: "https://docs.dhtmlx.com/diagram/samples/common/big_img/big-avatar-8.jpg",
parent: "3",
},
{
id: "3.3",
name: "Sophia Matthews",
post: "Attending physician",
phone: "(361) 423-7234",
mail: "smatthews@gmail.com",
photo: "https://docs.dhtmlx.com/diagram/samples/common/big_img/big-avatar-9.jpg",
parent: "3",
},
{
id: "3.4",
name: "Kara Foster",
post: "Attending physician",
phone: "(565) 525-0672",
mail: "kfoster@gmail.com",
photo: "https://docs.dhtmlx.com/diagram/samples/common/big_img/big-avatar-10.jpg",
parent: "3",
},
];
In order to fill your tree diagram with content, you have to apply the parse method.
6. Modify the appearance of specific elements in your JavaScript tree graph:
.dhx-diagram-demo_personal-card {
height: 100%;
display: flex;
align-items: center;
justify-content: center;
background: white;
color: rgba(0, 0, 0, 0.7);
border: 1px solid #DFDFDF;
padding: 10px 12px;
}
.dhx-diagram-demo_personal-card i {
color: rgba(0, 0, 0, 0.7);
height: 20px;
width: 20px;
font-size: 18px;
}
.dhx-diagram-demo_personal-card__info {
display: flex;
}
.dhx-diagram-demo_personal-card__info a {
color:#0288D1
}
.dhx-diagram-demo_personal-card__container {
height: 100%;
width: 100%;
overflow: hidden;
position: relative;
}
.dhx-diagram-demo_personal-card__container h3, .dhx-diagram-demo_personal-card__container p {
text-align: left;
font-size: 14px;
line-height: 20px;
height: 20px;
margin: 0 0 4px 0;
overflow: hidden;
text-overflow: ellipsis;
white-space: nowrap;
}
.dhx-diagram-demo_personal-card__container i {
margin-right: 4px;
}
.dhx-diagram-demo_personal-card__img-container {
min-width: 93px;
width: 93px;
margin-right: 12px;
}
.dhx-diagram-demo_personal-card__img-container img {
width: inherit;
height: auto;
}
</style>
And last of all, you can manipulate the look and feel of your HTML5 tree diagram by defining styles for personal card elements via CSS. You can apply a range of CSS properties to the elements of your choice and specify their dimensions, alignment, spacing, color, and any other settings.
Upon the completion of this final step, you can start using this tree diagram to outline the internal structure of a company.
Final Thoughts
This easy-to-follow guide shows how our JavaScript Diagram library can be used for building tree diagrams. Apart from this diagram type, you can build any other diagrams using simple HTML templates like network diagrams or UML class diagrams.
Take advantage of a 30-day free trial version and start diagramming right now.