If you have ever had to deal with designing a relational database, then you probably know about the key data visualization tool dedicated for this task – a JavaScript entity relationship diagram. This is one more useful type of diagram that can be built from scratch with DHTMLX Diagram, and we are eager to tell you how to do it in this post.
What is an Entity Relationship Diagram
An entity relationship diagram (also referred to as ER diagram or ERD) is a type of diagram that is intended for graphical presentation of data within a database via various entities, their attributes, and relations between them. This flowchart-like diagram helps to make sense of the database’s logical composition. It should be noted that ERDs are viable only when dealing with relational and structured data.
Entity relationship diagrams commonly illustrate three key components:
- Entity
Under entities in ER diagrams, we mean uniquely identifiable persons, objects, concepts, etc. about which data is stored in the system (like rows in databases). Entities are visualized with rectangles and indicated by singular nouns.
- Attribute
Attributes typically serve as named distinguishing characteristics for entities but can also describe particular traits of other main ERD components. Attributes can be considered as columns of your database. All diagram elements can have an infinite number of attributes that are depicted in oval shapes. Attributes are linked with entities and relationships through connectors.
- Relationship
Relationships show how multiple elements (entities) of the diagram relate to each other via some action. This action is shown with the help of diamond shapes and labeled using a verb. These relations are displayed using connectors with special symbols drawn on them known as cardinality. In the context of ERDs, cardinalities specify how many relationships can be established between the instances of different entities. There are several notation techniques that help to convey cardinality, and the most popular of them are Crow’s Foot and Chen’s notation.
ER diagrams have a large range of use, but they are especially popular in the spheres where databases are actively involved, such as the following:
- Software engineering
- Business analysis
- Educational projects
- Scientific studies
Example of a JavaScript Entity Relationship Diagram by DHTMLX
Now we are going to explore a basic JavaScript ER diagram built with the help of our diagramming control.
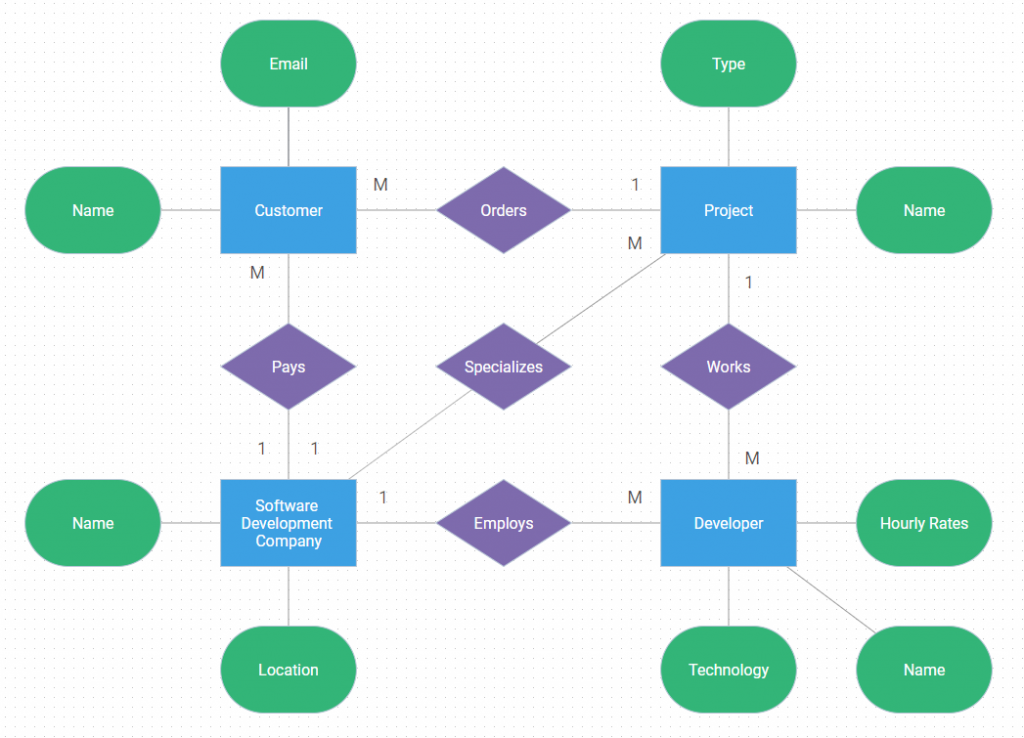
Our example showcases the entity relationship diagram for a software development company. The diagram structure includes four entities, and each entity is complemented with several attributes describing its unique properties:
- Software development company – Name, Location
- Customer – Name, Email
- Project – Name, Type
- Developer – Name, Technology, Hourly Rates
All the provided entities are related to one another via specific actions, namely Orders, Pays, Employs, Specializes, Works. In order to further define the relations between entities in a numerical context, we resort to 1-M (one-to-many) cardinal relationship from Chen’s notation type. Putting it in words, we get the following:
- There is a software development company that specializes in different types of projects ordered by customers. The company can have many customers and hire any number of developers for working on projects.
- A customer pays the company and can order only one project.
- One developer can work on one project, but one project can be fulfilled by many developers.
We have to point out that more complex ER diagrams can comprise different types and categories of diagram elements that we haven’t touched in our post.
How to Create a JavaScript Entity Relationship Diagram with DHTMLX
Using the DHTMLX diagramming component, it is possible to build ERDs via coding or right in the Diagram Editor.
The DHTMLX JavaScript entity-relationship diagram consists of predefined shapes and connectors. Thus, it takes just a couple of steps to initialize the diagram, configure its shapes, and populate the diagram with data. You can learn more about creating different diagram types in our documentation guide.
The Diagram Editor is an out-of-the-box tool for creating and designing diagrams without coding. It can be embedded into any web application and customized to your needs with the help of the DHTMLX Diagram API.
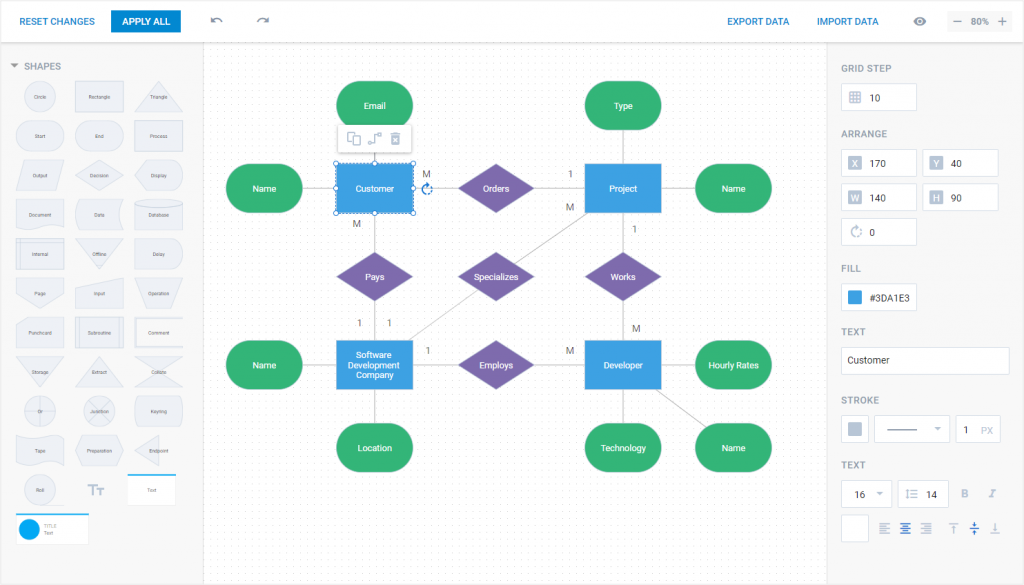
The Diagram Editor has an intuitive interface consisting of two side-panels, a grid area, and a toolbar. Thus, end-users won’t need much time to master its features and start diagramming.
 Download the JSON file of the DHTMLX entity relationship diagram and import it into the Diagram Editor via the Import Data button.
Let us highlight how to use the Editor’s main capabilities.
- Adding and connecting shapes
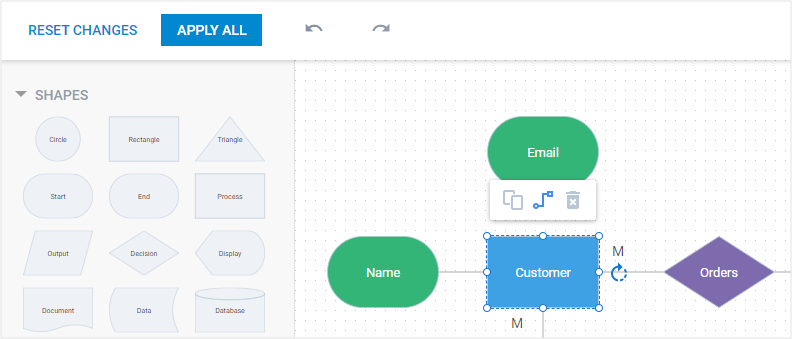
In the left-side panel, there is a list of built-in shapes including rectangle, oval, and diamond that are required for creating an ER diagram. All necessary shapes can be easily moved on the grid area by drag-and-drop and put together in a single structure via connectors. To accelerate the process, users can simultaneously manipulate (copy, paste, delete) shapes utilizing the multiselection function.
- Editing shapes and connectors
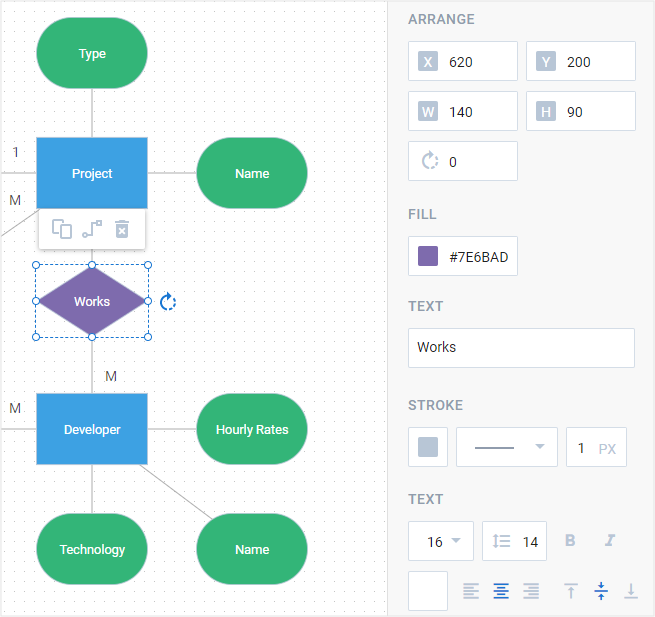
When a user clicks on a specific shape placed on the grid, it becomes editable and can be resized, moved, and rotated. At the same time, more advanced editing options become available in the right-side panel. Here users are able to make the ER diagram look exactly the way they like by specifying a precise size and positioning of a shape, modifying the stroke and background colors, choosing and applying an appropriate text style.
- Exporting/importing ER diagram
Finished diagrams can be exported/imported to the PDF/PNG and JSON formats. Thus, users can share their diagrams with colleagues, thereby enhancing the collaboration within their projects.
Following this simple algorithm, end-users can easily build an entity relationship diagram and continue using it for their business purposes.
Conclusion
All in all, our JavaScript Diagram component equips web developers with a wide range of capabilities for visualizing data via various types of diagrams by adding just a few lines of code or by arranging and styling needed shapes in the Diagram Editor.
Want to try it for free in your project? Here is a free 30-day trial version of our JS library.