<

JavaScript Tree Diagram

Tree diagrams are graphical representations of hierarchical structures or possible paths and breakdown structures, where elements are organized in a tree-like view with a root node and branches. On this page, you'll find tree diagram js examples built with DHTMLX, their features, and integration guides with Angular, React, and Vue.js.

Open a demo on desktop
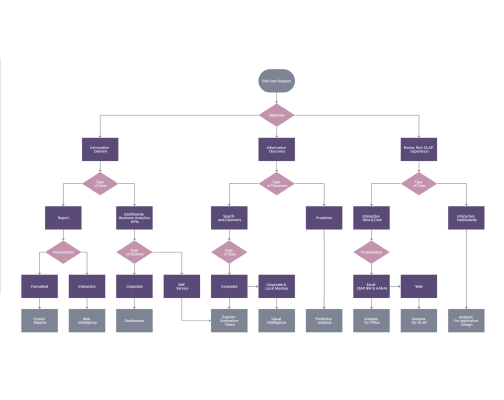
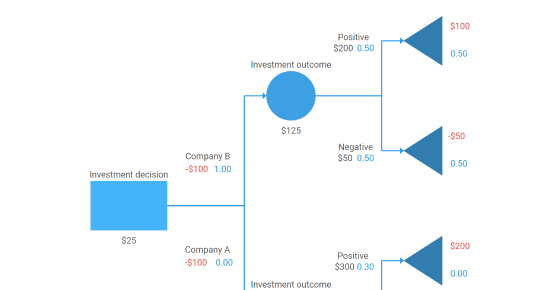
This vertical decision tree demo is made with the DHTMLX Diagram library.
Get a 30-day trial to test this demo and 20+ others in your projects free of charge.
Get free trial
Contents
Contents
This vertical decision tree demo is made with the DHTMLX Diagram library.
Get a 30-day trial to test this demo and 20+ others in your projects free of charge.
Get free trial

What Is JS Tree Diagram Used for

A tree diagram represents parent-child relationships between tree elements that start with a central node indicating a problem they need to solve or an idea they have to analyze. Each possible solution or event has its branch, which comes off the central node and comprises one or several nodes. Additional decisions or consequences split off from each of these branches, thus giving the diagram an easily recognizable tree-like structure.

HTML/JavaScript tree diagram types have gained popularity due to their combination of simplicity and high adaptability. They come in handy in web applications in various fields, including business management, computer science, genealogy, mathematics, etc.

DHTMLX JavaScript data visualization library for tree diagrams allows you to easily integrate any hierarchical or decision-making graph into your web app. It empowers developers to build any diagram type within seconds, configure their behavior, and customize their look through a versatile API or by adding custom CSS. Being a pure JavaScript library, DHTMLX Diagram supports integrations with various technical stacks, including Angular, Vue.js, React, and TypeScript.
Key Features of DHTMLX JavaScript Tree Diagram Library

Built-in shapes
Built-in shapes
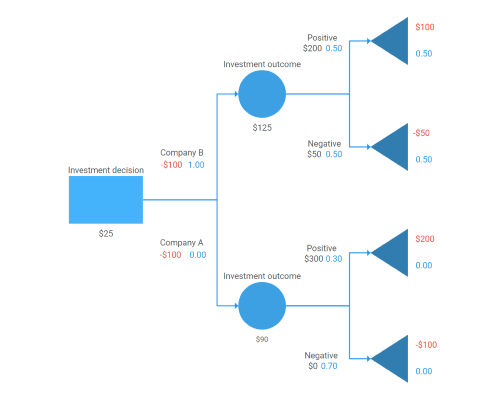
DHTMLX library includes 30+ different shapes from which users can choose to draw clear tree diagrams. Thus, for example, they can build a decision tree by combining a main rectangular shape to indicate a decision to be made, circular shapes to represent possible alternatives, and triangular or endpoint shapes to illustrate possible consequences.
Configurable connectors

In general, tree diagrams are drawn from left to right. Tree shapes are connected with elbow lines or arrows which may include text and numbers to show estimated costs or any other vital data. With DHTMLX, you can make arrows dashed, apply different colors, or set a default type for all the connectors.

Parent and child shapes
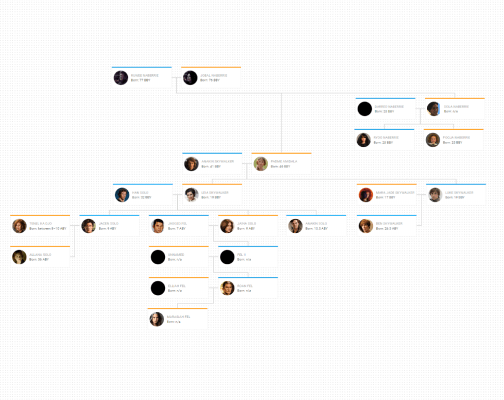
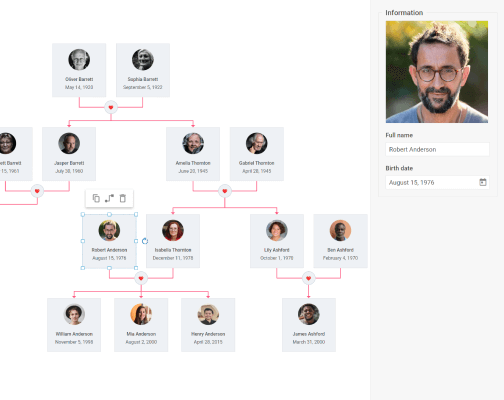
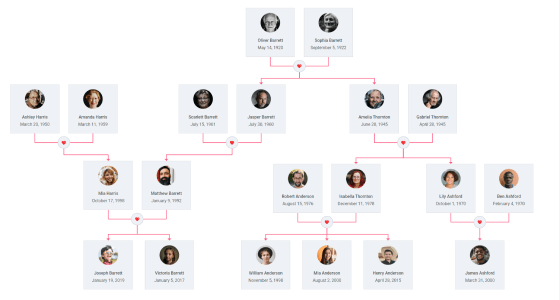
Apart from building a decision tree diagram JS, you can allow your users to create a family tree to visualize kin relationships within their family. Here you can see an example of a part of the British royal family tree with the line of succession highlighted in red.
Setting custom shape templates

DHTMLX JavaScript tree diagram library allows you to create a proper shape template. Therefore, you can empower your users to add pictures of their family members, record their names and dates of birth, attach icons, and any other HTML elements.

Collapsing child shapes

You have the option to equip your JavaScript tree diagram with an icon for expanding family tree branches containing one or more child shapes. Moreover, you can specify which shapes will always be displayed, and which will be hidden by default.

Configurable shape toolbar
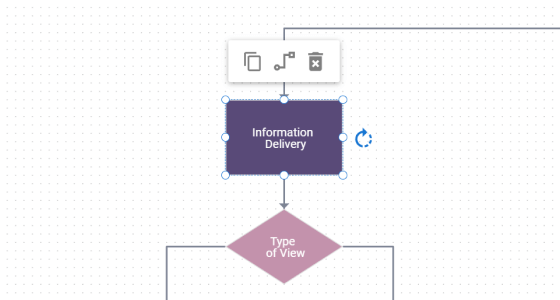
To build a user-friendly interactive tree diagram in JavaScript, you can add editable shapes and equip them with a toolbar. This element can contain any icon and provide end-users with the specified options for managing tree diagram shapes in a few clicks. For example, users may create a copy of the selected shape, delete it, and set connections between different shapes.
Zooming and scrolling

When dealing with widely-branched data-intensive tree diagrams, it's convenient to use zooming and scrolling features. These functionalities empower end-users to easily navigate through the diagram by zooming in or out or using horizontal and vertical scrolls.

Export to PDF/PNG

Exporting your JavaScript tree diagram to readable formats, including PDF and PNG, is an essential and highly convenient option. DHTMLX Diagram library offers multiple exporting options, enabling you to set up a local export module or use the DHTMLX online export service.

Touch support

Diagrams created with the DHTMLX library can be seamlessly viewed and edited on any device, thanks to its touch support functionality. Commonly used gestures, e.g. tap, press, double tap, hold, and drag are supported thus simplifying the interaction process with tree elements.

Localization

By default, the Diagram editor interface is set to an English locale. You can modify this feature and set any desirable locale by providing the appropriate labels via the API.

JS Tree Diagram Library Integrations

DHTMLX Diagram is a JavaScript library you can integrate into any web application. Moreover, you can use the library with Angular, Vue.js, React, TypeScript, and other modern frameworks and technologies. We provide you with multiple code snippets and ready-made demos on GitHub to help you with integrating processes.

Live demo
Using DHTMLX tree diagrams with
GitHub demo
Using DHTMLX tree diagrams with
Guide
TypeScript support
JS Tree Diagram Examples
Take your data visualization to the next level with DHTMLX Diagram
Download the DHTMLX trial version and evaluate it free of charge for 30 days benefiting from the official technical support of our team.
NO credit card required