<

JavaScript Flowchart

A flowchart is a visual representation of a logical flow and structure. This diagram type comes useful for planning and designing code, troubleshooting, and explaining complex algorithms. Here you’ll find a ready-made flowchart template created with DHTMLX Diagram, key features, and integration guides with React, Angular, and Vue.js.

Open a demo on desktop
This flowchart template is made with the DHTMLX Diagram library.
Get a 30-day trial to test this demo and 20+ others in your projects free of charge.
Get free trial
Contents
Contents
This flowchart template is made with the DHTMLX Diagram library.
Get a 30-day trial to test this demo and 20+ others in your projects free of charge.
Get free trial

What Flowcharts Are Used for and How To Add a Flowchart in JavaScript To Your Web App with DHTMLX

Flowcharts are versatile visual tools used across multiple fields to represent processes, systems, and decision-making pathways. They serve as a handy way to document the step-by-step activities within an organization. Whether applied in project planning, software development, network design, or business modeling, flowcharts provide a clear and structured overview of complex procedures.

The effectiveness of a JavaScript flow chart extends to troubleshooting, where it guides users through systematic decision paths to identify and resolve issues. Moreover, being a valuable communication tool, flowcharts facilitate understanding among stakeholders, making them an indispensable resource in enhancing organizational efficiency.

With DHTMLX, you can add any HTML 5 flowchart to your web app. Our JavaScript flowchart library allows you to quickly and easily create diagrams and style them to fit your project requirements using a feature-rich API and adding custom CSS. You can also seamlessly integrate the library with any tech stack, including React, Angular, Vue.js, TypeScript, etc.
Key Features of DHTMLX JavaScript Flowchart

30+ ready-made shapes

You can use flowcharts in numerous ways to visualize data with the help of various graphic elements specific to this diagram type. DHTMLX flowchart builder provides 30+ different shape types that you can uniquely combine to represent your data in a custom way.

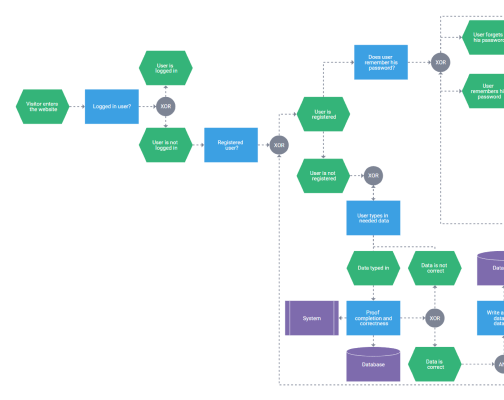
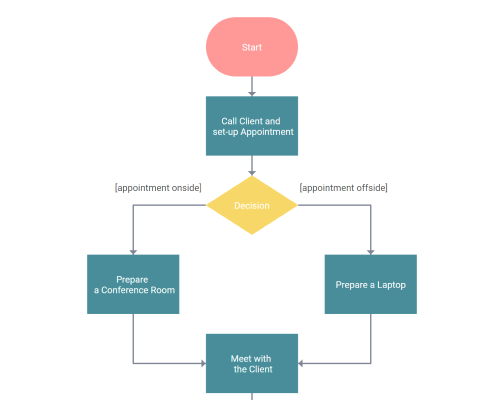
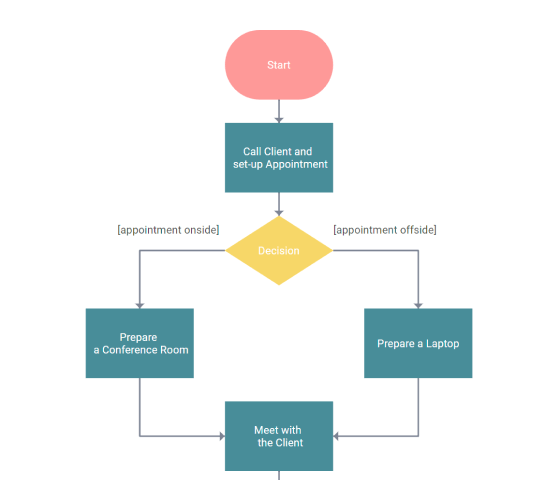
Thus, for example, you may attach “start” and “end” oval-shaped nodes to indicate the initial and final points of a process. In the middle of a flowchart, you can add rectangle “process” shapes to denote certain steps of a process. If you’re looking to specify the conditions in which the process is developing, you can draw a diamond “preparation” shape.

Ability to create custom shapes

If your flowchart software requires more than default shapes, you can easily add custom ones. It’s possible to create shape templates and use them to build any diagram you need.

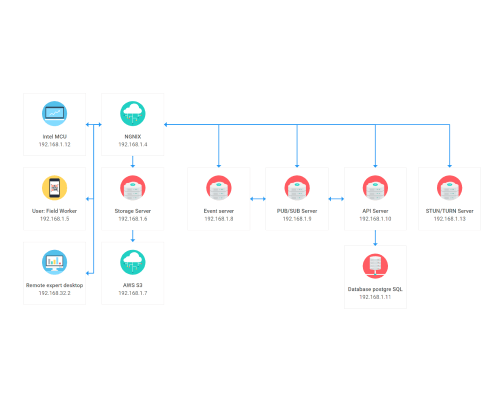
For example, you can draw a network diagram by setting a custom card shape that will render an image, title, and IP address.

Built-in auto-placement algorithms

DHTMLX provides auto-layout modes to accurately arrange shapes and connectors with a single mouse click. There are 2 smart algorithms available:

  • orthogonal for placing shapes along vertical and horizontal lines;
  • radial for arranging shapes around the relative central node.

You can also configure settings for the auto-placement, e.g. modify the mode of connecting shapes and distance between unconnected diagrams, via flowchart API.

Labels for connectors
Ability to create custom shapes

While building JavaScript flowcharts, connectors are essential for visualizing relationships between flowchart elements. They make data much easier to understand and ensure your diagram is read correctly.

By default, flowchart shapes are connected by straight or elbow lines. However, you can make them dashed, set different colors, or add text by double-clicking on a line. It’s also possible to edit the text by clicking on it twice.

Adding swimlanes

The following flowchart JavaScript example includes swimlanes. These elements are used to divide the whole visualized process into separate stages to simplify the understanding and work with elaborate data structures for end-users.

Zooming and scrolling

Wide data-intensive flowcharts can be read successfully with the help of zooming and scrolling features. Thus, your end-users can zoom in or out of the diagram depending on its size. You may also add horizontal and vertical scrolls for handy moving throughout the flowchart.

Export to PDF/PNG

Using the feature of exporting your flowchart JS examples to readable formats, including PDF and PNG, is crucial and always comes in handy. DHTMLX Diagram library provides several exporting options allowing you to set up a local export module or using DHTMLX online export service.

Touch support

Our JavaScript flowchart library allows your end-users to view and edit diagrams on any device, as it includes touch support. Such commonly used gestures as tap, double tap, press, hold, and drag are supported and make it easy for users to interact with flowchart elements.

Localization

The default Diagram editor interface is based on an English-speaking locale, however, it can be localized according to your project requirements. Therefore, you have to provide the correct labels via the API to translate the JavaScript flowchart builder interface.

Flowchart JS Integrations

Integrating DHTMLX JavaScript flowchart library into any web application is a seamless process. You’re free to use code snippets and ready-made demos on GitHub to get help with integrating flowcharts with Angular, Vue,js, and React as well as using the library with TypeScript.

Live demo
Using DHTMLX flowchart with
GitHub demo
Using DHTMLX flowchart with
Guide
TypeScript support
Flowchart Examples
Take your data visualization to the next level with DHTMLX Diagram
Download the DHTMLX trial version and evaluate it free of charge for 30 days benefiting from the official technical support of our team.
NO credit card required