Last time we explained how to use dhtmlxScheduler with AngularJS, a popular JavaScript MVW framework. In this tutorial, we will guide you through adding an interactive Gantt chart to an AngularJS app using DHTMLX Gantt. The Gantt component is available in both free and paid editions. The free Community Edition is distributed under the MIT license, which allows using the core Gantt functionality in commercial and open-source projects. The PRO Edition comes with a powerful pack of advanced features and professional tech support offered under commercial DHTMLX licenses.
Note: This tutorial is outdated and targets AngularJS (1.x), which is no longer officially supported. For modern Angular projects, please use the up-to-date guide on integrating DHTMLX Gantt with Angular provided in the official documentation. You can also check the DHTMLX Gantt with Angular demo on GitHub.

You can check the online demo, or just grab the final demo from GitHub.
What would you like to see in our next articles about dhtmlxGantt?
We need your feedback to provide the right integrations at the right time. Please leave your requests here:
Adding dhxGantt Directive
To build a custom HTML component in AngularJS, we need to create a new directive. So we start the integration of dhtmlxGantt from writing a directive for it. For that, we create a .js file with the following content:
app.directive('dhxGantt', function() {

  return {

    restrict: 'A',

    scope: false,

    transclude: true,

    template: '<div ng-transclude></div>',

    link: function ($scope, $element, $attrs, $controller) {

      //size of gantt

      $scope.$watch(function() {

        return $element[0].offsetWidth + "." + $element[0].offsetHeight;

      }, function() {

        gantt.setSizes();

      });


      //init gantt

      gantt.init($element[0]);

    }

  }

});
This is what the above code does:
- the code defines a new directive which can be used as a custom attribute
- the new directive will initialize dhtmlxGantt in the target container
- the $watch function will check the size of dhtmlxGantt’s container and will resize the component when the size of the HTML container is changed
If we just need to create an instance of dhtmlxGantt on a page, the above code is enough. We just need to place the directive somewhere on the page. If we need to create a simple AngularJS app with a Gantt chart inside, we need the following HTML code structure:
<!doctype html>

<html ng-app="ganttApp">

<head>

  <title>AngularJS Gantt chart demo</title>

  <script src="https://ajax.googleapis.com/ajax/libs/angularjs/1.6.6/angular.min.js"></script>

  <script src="https://cdn.dhtmlx.com/gantt/edge/dhtmlxgantt.js"></script>

  <link rel="stylesheet" href="https://cdn.dhtmlx.com/gantt/edge/dhtmlxgantt.css">

  <script src="js/app.js"></script>

</head>

<body>

  <div dhx-gantt style="height: 350px; width: 100%;"></div>

</body>

</html>
If you look at the code above, you’ll see that we included the .js and .css files of both the AngularJS framework and the dhtmlxGantt component. The dxhGantt directive, which we created earlier, is used in the code of the page. The dhx-gantt attribute is used to trigger the directive and to initialize the dhtmlxGantt component on the page. Now, if you open a page with the described HTML code in a browser, you can see the Gantt chart but without any data yet:

Linking to a Scope
At this stage the DHTMLX Gantt chart just renders itself on a page, which is good but not quite useful yet. To expand the functionality of our demo app, we now need to link the content of the Gantt chart to the scope. So we extend the link method of the directive like this:
link: function ($scope, $element, $attrs, $controller) {

  //watch data collection, reload on changes

  $scope.$watch($attrs.data, function(collection) {

    gantt.clearAll();

    gantt.parse(collection, "json");

  }, true);


  //size of gantt

  $scope.$watch(function() {

    return $element[0].offsetWidth + "." + $element[0].offsetHeight;

  }, function() {

    gantt.setSizes();

  });


  //init gantt

  gantt.init($element[0]);

}
The new block of code at the top will monitor the state of data collection and reload the Gantt chart with new data when collection is changed.
After applying such changes we can load data from the scope to the Gantt chart:
app.controller('MainSchedulerCtrl', function($scope) {

  $scope.tasks = {

    data:[

      {id:1, text:"Project #2", start_date:"01-04-2018", duration:18, order:10, progress:0.4, open: true},

      {id:2, text:"Task #1", start_date:"02-04-2018", duration:8, order:10, progress:0.6, parent:1},

      {id:3, text:"Task #2", start_date:"11-04-2018", duration:8, order:20, progress:0.6, parent:1}

    ],

    links:[

      { id:1, source:1, target:2, type:"1"},

      { id:2, source:2, target:3, type:"0"},

      { id:3, source:3, target:4, type:"0"},

      { id:4, source:2, target:5, type:"2"}

    ]

  };

});
Now we have a Gantt chart populated with data. The next step will be customizing the appearance of tasks in the chart.
Defining the Look of Tasks
It’s time to define the content and appearance of tasks in the Gantt chart. To specify the look of tasks, we will use dhtmlxGantt JavaScript API for templating. The following code will define one more directive which can be used to define the templates of our Gantt chart:
app.directive('ganttTemplate', ['$interpolate', function($interpolate) {

  return {

    restrict: 'AE',

    terminal: true,

    link: function($scope, $element, $attrs, $controller) {

      var interpolated = $interpolate($element.html());

      gantt.templates[$attrs.ganttTemplate] = function(start, end, task) {

        return interpolated({task: task});

      };

    }

  };

}]);
This code defines the ganttTemplate directive. This directive can be used both as an attribute or as a custom tag. The content of the directive will be compiled to JavaScript function using the ‘$interpolate service’ and used as a template of the Gantt chart. To specify the template for the Gantt chart, you can use Angularjs template syntax.
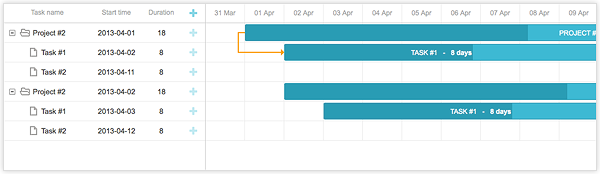
For instance, we can add this piece of code on the page:
<gantt-template name="task_text">

  <div>{{task.text | uppercase}} - <strong>{{task.duration}} days</strong></div>

</gantt-template>
If we now reload the page with our demo app, we should see the following:
The name of “gantt-template” attribute is a name of dhtmlxGantt’s template which needs to be defined. You can find the list of available templates in the dhtmlxGantt documentation.
NOTE: the template defined in such a way does not have the full functionality of a native AngularJS template. You should consider the following points:
- You need to use the format of the type {{task.some}} to define the template. Instead of “some“, place the necessary property of task object. “task.” in our example is a fixed part that is used only by the Gantt chart to define the task’s property. It is not related to the current scope.
- The scope’s variables can’t be used inside of the template.
Grid Configuration
One more thing which can be done is configuration of the grid in dhtmlxGantt. We can add one more directive (actually two directives) to configure the columns and data in them.
app.directive('ganttColumn', ['$interpolate', function($interpolate) {

  return {

    restrict: 'AE',

    terminal: true,

    link: function($scope, $element, $attrs, $controller) {

      var label = $attrs.label || " ";

      var width = $attrs.width || "*";

      var align = $attrs.align || "left";


      var interpolated = $interpolate($element.html());

      var template = function(task) {

        return interpolated({ task: task });

      };


      var config = { template: template, label: label, width: width, align: align };


      if (!gantt.config.columnsSet)

        gantt.config.columnsSet = gantt.config.columns = [];


      if (!gantt.config.columns.length)

        config.tree = true;


      gantt.config.columns.push(config);

    }

  };

}]);
The above code is very similar to ganttTemplate directive. It takes attributes from the tag, converts the content of the tag to the template and creates a new column in the grid’s configuration.
In addition to data columns, dhtmlxGantt can have extra column with “add task” icon. To add such a column, we can create a separate directive:
app.directive('ganttColumnAdd', [function() {

  return {

    restrict: 'AE',

    terminal: true,

    link: function() {

      gantt.config.columns.push({ width:45, name:"add" });

    }

  }

}]);
With the above JS code, we can configure the grid columns through HTML code like this:
<div dhx-gantt data="tasks" style="height: 300px; width: 100%;">

  <gantt-column label="Task" width="200" align="left">

    <div>{{task.text | lowercase}}</div>

  </gantt-column>

  <gantt-column label="Duration" width="80" align="center">

    <div align="center">{{task.duration}}</div>

  </gantt-column>

  <gantt-column-add></gantt-column-add>

</div>
With such a configuration, the Gantt chart will look like this:

Download dhtmlxGantt to add a powerful Gantt chart to your app
Summing Up
Although AngularJS doesn’t provide rich user interface widgets, we can add such a widget with the help of some additional code. This tutorial showed how using the custom directives (dhxGantt, ganttTemplate, ganttColumn and ganttColumnAdd), you can easily add an editable Gantt chart on the page and customize its appearance.
The above described functionality of the Gantt chart library shows only the basic features. dhtmlxGantt has a rich API and lot of properties and events. It makes no sense to wrap all of them into AngularJS directives, as you can easily make any necessary calls from Angular controller’s code (find the details of the dhtmlxGantt API in the documentation).
With a bit of code, you can integrate dhtmlxGantt in an AngularJS app and get an interactive Gantt chart for project scheduling needs.