Even though the first official release of dhtmlxChart was introduced just 2 months ago, today we are ready to present its update pack. You will be pleasantly surprised by the various useful features we have added to our JavaScript charting library.
Area Chart
Our first piece of good news is the announcement of a new type. We have extended the types variation with the area chart. The stacked area charts are just the thing to use when you need to show how a separate data value contributes to the total, or which part of the whole this value represents. The component can also draw series of area charts.

Area charts: series and stacked
Spline Chart
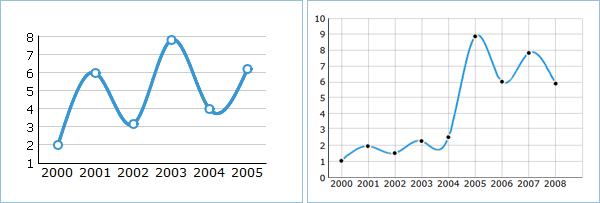
Another new type is the spline chart, which is similar to the line chart, but a curve approximates the intervening values and goes smoothly between data points. You may also generate a series of spline charts, if needed.

Spline chart
Series of Charts
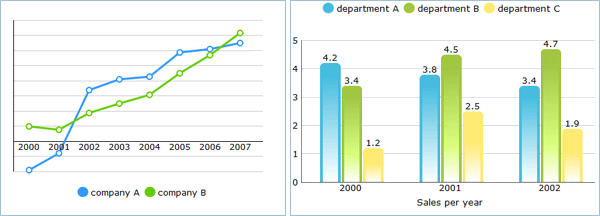
As you may have already noticed, we have added the ability to display a series of charts, a feature unavailable in the previous release. This new feature works for the majority of available chart types (line, spline, bar, and area charts).

Chart series - Line and bar charts
Legend and Origin
Improvements in properties include legend and origin. A legend was already available for the pie chart, but now it’s available for all types. It can be very helpful when you draw a chart series and want to add explanations or descriptions for each individual series.
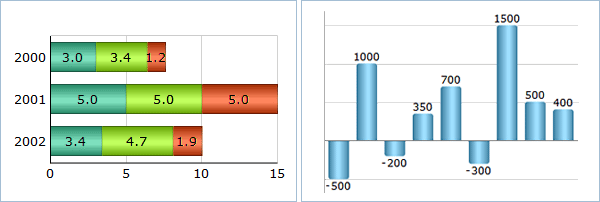
The origin’s position – in other words, the zero of the coordinate system – can now be defined for line, spline, and vertical bar charts. This feature allows you to display negative values on a graph.
Extended Bar Chart
With all the new features introduced in this release, the bar chart now gives you the freedom to present your data in a more illustrative and intuitive way. Advanced features include: stacked bar chart, chart series, the option to show negative values below zero, and horizontal bar charts.

Bar charts - Horizontal, stacked, and displaying negative values
IE9 Support
The last thing we’d like to mention is support for Internet Explorer 9.0. As promised, we updated DHTMLX components upon the release of the latest version of Internet Explorer.
So these were the main updates, and they should give you a good feel for the full range of changes. The details and download link to the updated package can be found on dhtmlxChart homepage.
By the way, if you have some ideas about what more can be changed or added to improve dhtmlxChart, we welcome your comments below.