Updated on September 25, 2025
DHTMLX provides JavaScript UI components for implementing various highly-demanded functionalities in business web projects. DHTMLX Diagram fully covers the need for visualizing complex datasets on a web page.
We live in a time of information abundance and swiftly changing trends. On a business level, selecting the right approach to processing large volumes of data significantly impacts the accuracy of decisions made and their influence on the overall success of any undertaking. Data visualization is a proven method of reducing the distance between raw data and actionable insights. The issue of making this method more flexible and easy-to-use led to the growing popularity of non-coding data visualization solutions on the web.
In such cases, many web developers rely on DHTMLX Diagram. They appreciate our JavaScript diagrams for a flexible API and well-written documentation. But there is one more thing that makes our product special compared to other options currently available on the market. It is the DHTMLX Diagram editor.
In this article, we will provide you with a detailed overview of our JS diagram editor and explain how it can be useful for your web project.
What Is DHTMLX JavaScript Diagram Editor?
DHTMLX Diagram editor is an out-of-the-box JavaScript tool designed to make data visualization on the web fast and simple. It helps to create and edit different types of diagrams on the fly, thereby bringing in extra flexibility required for effective working with frequently changing data. But the most pleasant thing about using our JS diagram editor is that you don’t have to perform any code manipulations at all.
Who Can Benefit from DHTMLX JS Diagram Editor
Our JavaScript diagram editor can be a smart investment, an intuitive diagramming instrument, and a handy JavaScript development tool. In other words, it brings value to businesses, web developers, and end-users.
The use of a JavaScript diagram editor like the one from DHTMLX is a non-trivial approach to visualizing data on the web, combining enhanced usability and cost efficiency. Therefore, businesses can see this functionality as a significant user empowerment and a competitive edge for various projects, from enterprise apps to SaaS products. The DHTMLX Diagram editor is also an appealing JavaScript diagramming solution for SaaS and startups, as it requires fewer engineering efforts and speeds up product launch.
When talking about the practical value of this diagramming tool for web developers, it can be applied for building UML diagrams that significantly simplify communication within a dev team when delivering apps of any scale. It is also a good practice to use DHTMLX-based diagrams in combination with the editor as a simple JavaScript app for data visualization.
From the end-user perspective, our JavaScript diagram editor provides a convenient tool for building and editing diagrams in an intuitive and code-free way.
Editing Modes in DHTMLX JS Diagram Editor
One of the main peculiarities of the DHTMLX editor is the availability of several editing modes.
Currently, you can make use of three modes:
- Default mode
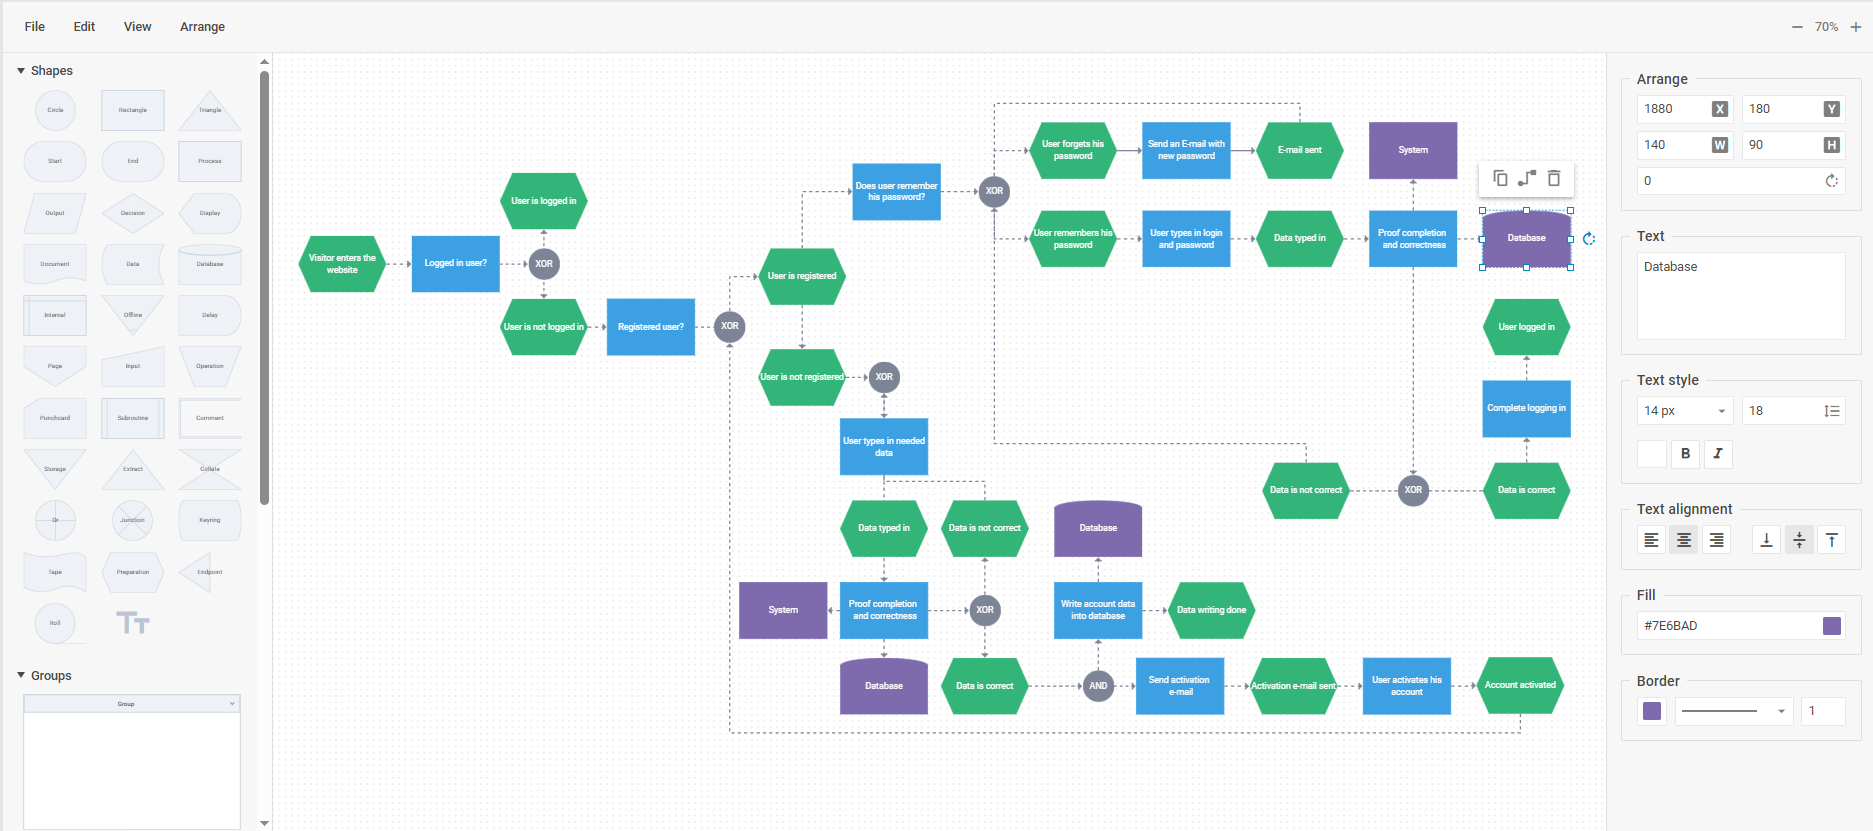 Check the sample with a wide flowchart in default mode>
This mode can be a great alternative to any JavaScript flowchart editor. It comes with a range of predefined shapes for creating popular diagram types such as flowcharts, decision trees, UML class diagrams, network diagrams, etc. Utilizing these shapes, you can also build a combination of two or more diagrams. Apart from diagram shapes, this mode provides two useful visual elements – swimlanes and groups.
As mentioned, this mode serves for delivering technical diagrams of various types and structures; therefore, it is enriched with useful features to facilitate the work with complex visualizations:
- automatic layout algorithm (orthogonal (default) and radial)
- alignment – six options for simultaneously aligning a group of selected shapes
- distribution – controls for evenly spacing multiple selected items at once
- snap lines – visual aids that help manually arrange shapes on the grid with high accuracy
Thus, this mode is a valid answer to the question of how to create flowcharts in JavaScript without coding.
- Org chart mode
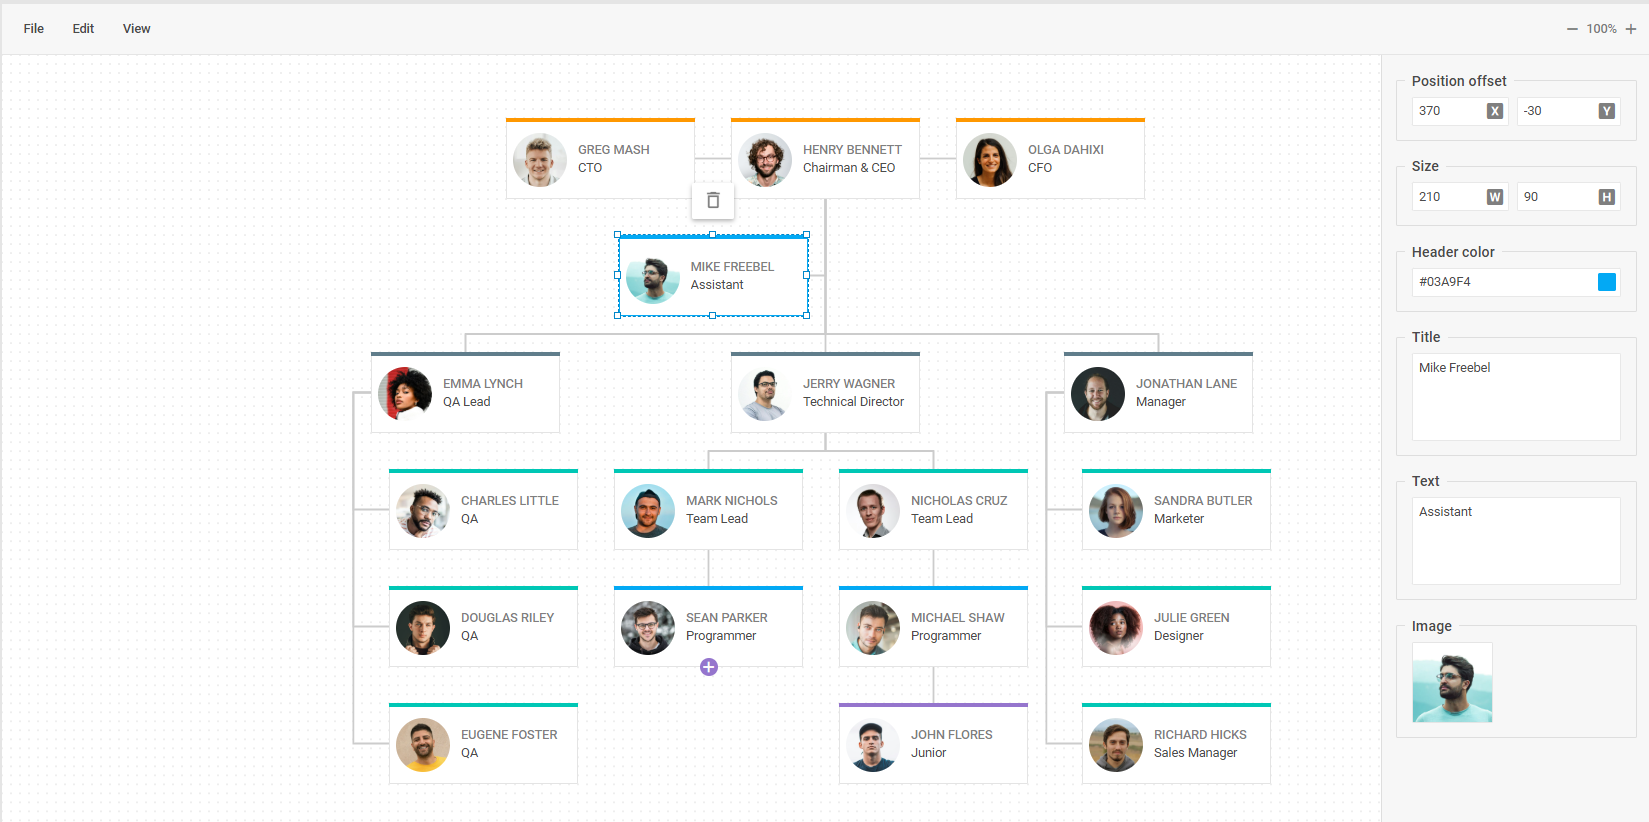 Check the sample with a wide basic org chart diagram>
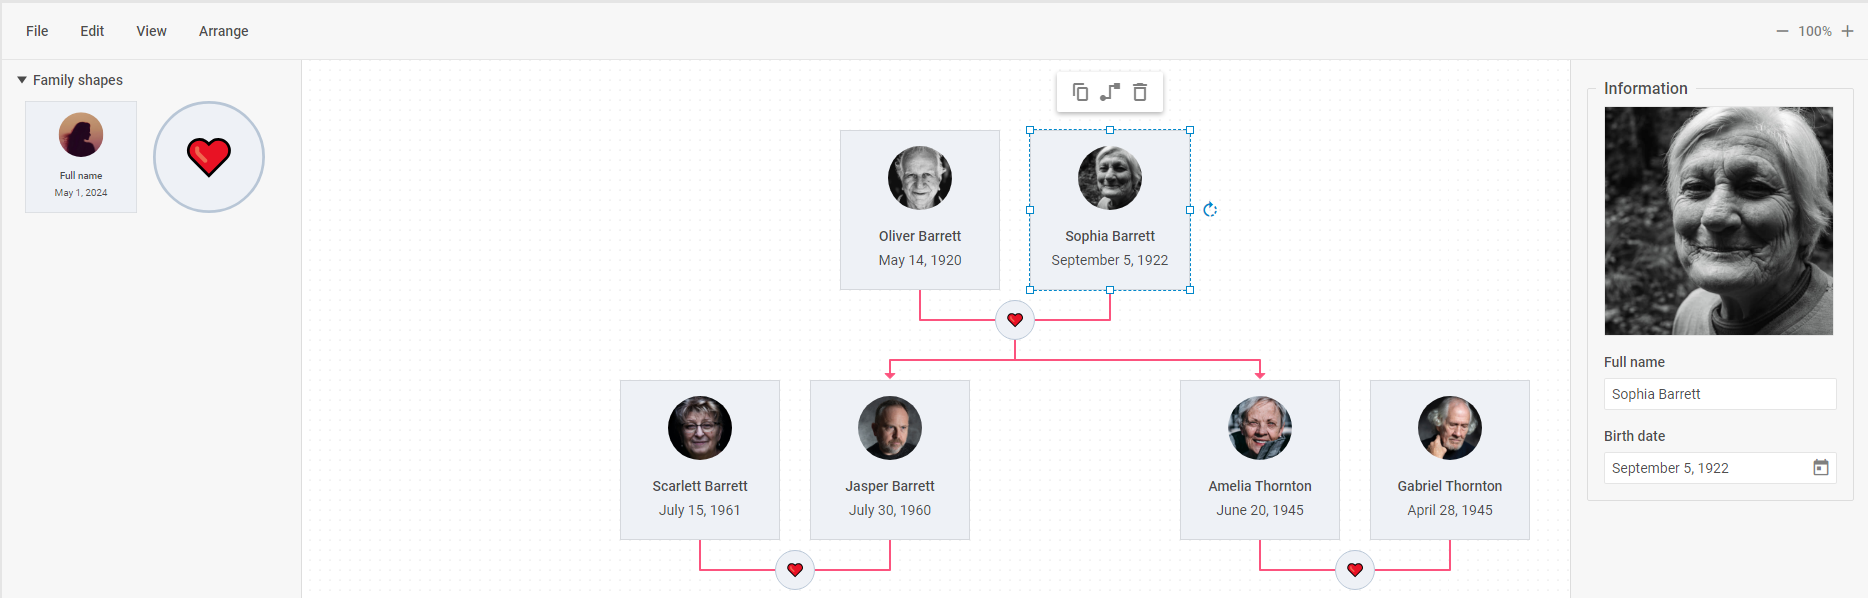
In this mode, you get a JavaScript org chart editor to visually present a company’s internal structure via an organizational chart. This mode is also great for building family trees.
Any parent shape in the org chart mode can be complemented with assistant and partner items. The first item helps to show assistants and secretaries in the organization’s structure, while the second one is essential for creating family trees.
- Mind map mode
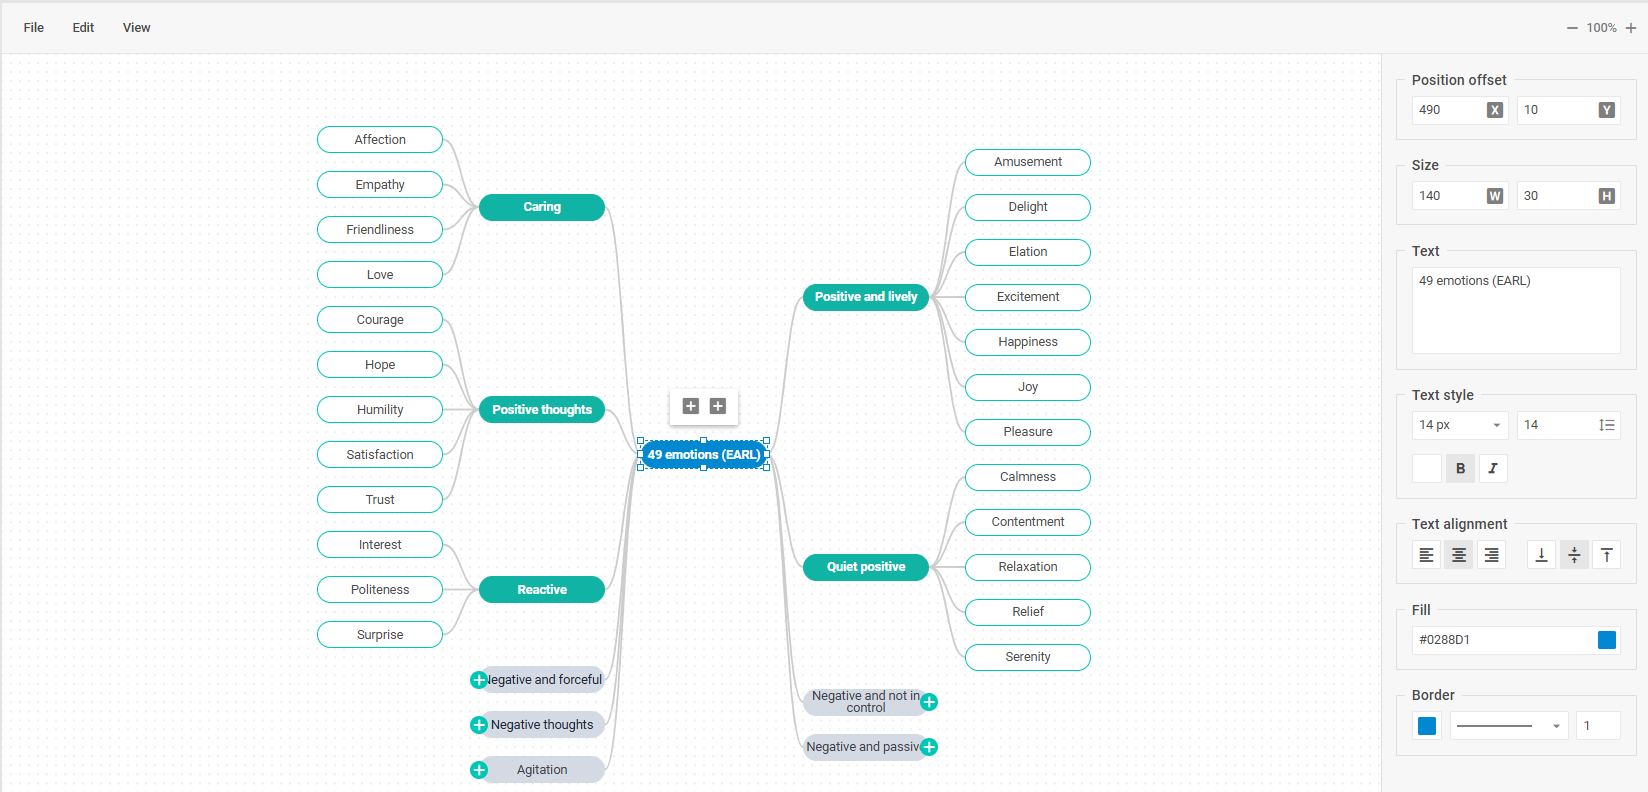 Check the sample with a mind map diagram>
This mode enables a JavaScript mind map editor solely dedicated to depicting various ideas and concepts. The DHTMLX mind map commonly consists of “topic” shapes that are connected by “curved” lines and placed around the main idea. Other types of shapes can be used in DHTMLX mind maps as well.
You may wonder why we decided to create separate modes for org charts and mind maps. The core reason behind that is to make your work with our JavaScript tool more convenient and productive. In the default mode, you can also build these types of diagrams, but it will be time-consuming. Knowing that diagrams used for presenting hierarchical data are quite predictable in terms of structure, we created two modes based on standardized arrangement algorithms to help you save time when diagramming with DHTMLX. In org chart and mind map modes, you don’t have to think much about the diagram’s structure since this part of the job is performed under the hood.
Core Elements of the JS Diagram Editor: Toolbar, Shapebar, Grid, Editbar
The first thing that catches the eye when you start working with the DHTMLX Diagram editor is its simple and intuitive UI. You can quickly master this tool and make the most of it in your projects.
Let us get acquainted with all parts of our JavaScript diagram builder and its capabilities in more detail.
Toolbar
Toolbar
The toolbar is a control panel at the top of the editor that provides centralized access to all essential operations available for managing various aspects of visualization. By default, toolbar options are grouped into 4 main logical sections:
- File – importing (JSON) and exporting (JSON, PDF, PNG) visualizations
- Edit – managing and editing diagram elements (undo/redo, copy, paste, duplicate, etc.)
- View – controlling the appearance and visibility of the editor UI (theming, showing/hiding editor sections, toggling features on/off, and zooming actions)
- Arrange (in default mode only) – arranging diagram elements in the grid area (auto layout, alignment, distribution)
 Check the sample with the auto layout algorithm>
Altogether, the editor’s toolbar provides a wide range of tools for managing the editing process and final outputs of diagramming tasks, while keeping the UI clean and straightforward.
Shapebar
The shapebar is available only in the default mode. It serves as a kind of storage unit for previews of items provided in the JavaScript diagram editor. In addition to a pack of predefined diagram shapes, the panel also includes two types of visual elements for building diagrams with comprehensive structures. These are groups and swimlanes.
By default, the shapebar is divided into three corresponding parts. Any diagram item presented in this panel can be easily moved to the grid area to shape diagram structures with drag-and-drop actions.
Grid area
The grid area (editor canvas) is the main working space where you actually organize various visual elements into the required diagram structures.
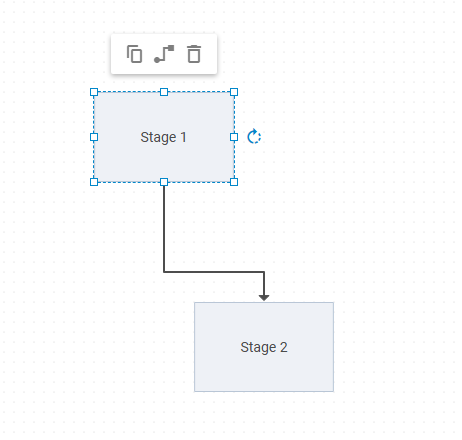
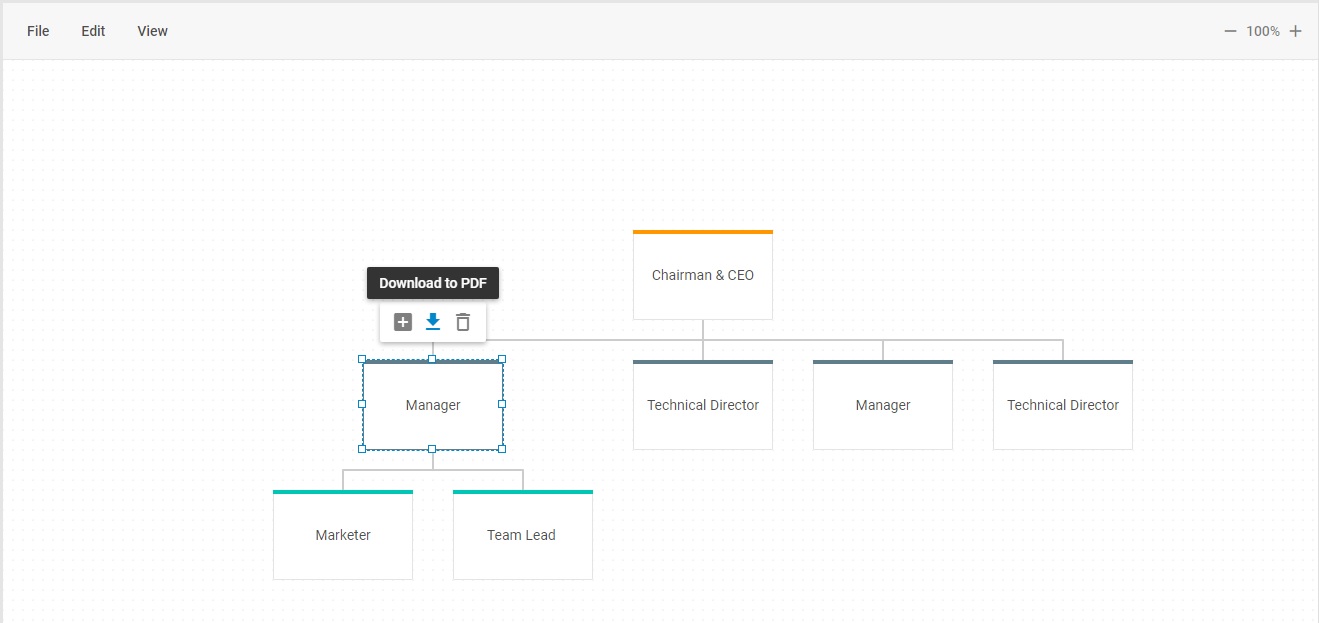
In this section, diagram elements can be manipulated separately or in groups. To manage a particular shape, you just have to click on it, and you’ll see a personal toolbar displaying available editing operations for a given item.
For shapes, the list of editing options provided in personal toolbars depends on the enabled editing mode and shape positioning.
In the default mode, a selected shape can be copied, removed, or complemented with a connector line. Also, there are options for rotating and resizing the shape.
When selecting a group of shapes in this mode, it is possible to move them around the Grid Area, create a copy, and apply alignment and distribution operations.

In org chart and mind map modes, you instantly reposition any parent shape together with its children using drag and drop, thereby rearranging the structure of your diagram with minimum time and effort.
 Check the sample with the org chart diagram>
In the default mode, it is possible to manipulate not only shapes, but also other elements like connector lines, groups, and swimlanes.
When managing connector lines, you can play around with their form and positioning, or remove excessive ones. When your diagram becomes too complicated, the ability to add clarifying text labels will help viewers to fully understand the visualized processes. The text is added via the content menu or after a double-click on the needed line.
After adding a group element to the grid area, you can embed shapes or other groups in it, move them around as a single unit. A personal toolbar of this element includes copy and delete options. Also, it is possible to expand/collapse the group, change the group’s size using resizing handles, and change its header title.
 Check the sample with the virtual private cloud architecture>
With swimlanes, you have not only basic operations (reposition, copy, delete, resize, etc.), but also options for modifying their structure (add, remove, reorder columns and rows).
 Check the sample with the waterfall diagram template>
As you can see from the sample above, our online JS Diagram editor also supports inline editing, which allows editing the content of diagrams in the grid area on the go.
One more noteworthy feature available in the grid area is the ability to extend a particular styling pattern of one shape to another one (or to a whole group) with a couple of hotkey combinations. You just select a shape with the desired styling, copy it (Alt(Option)+Ctrl
(Cmd)+С), and apply (Alt (Option) + Ctrl (Cmd) + V) to the target shapes. This feature is available in all three editor modes.
 Check the sample with the vertical decision tree>
Also, you can make use of multiple keyboard shortcuts for performing various operations in the grid area. The full list of available shortcuts is provided on this page.
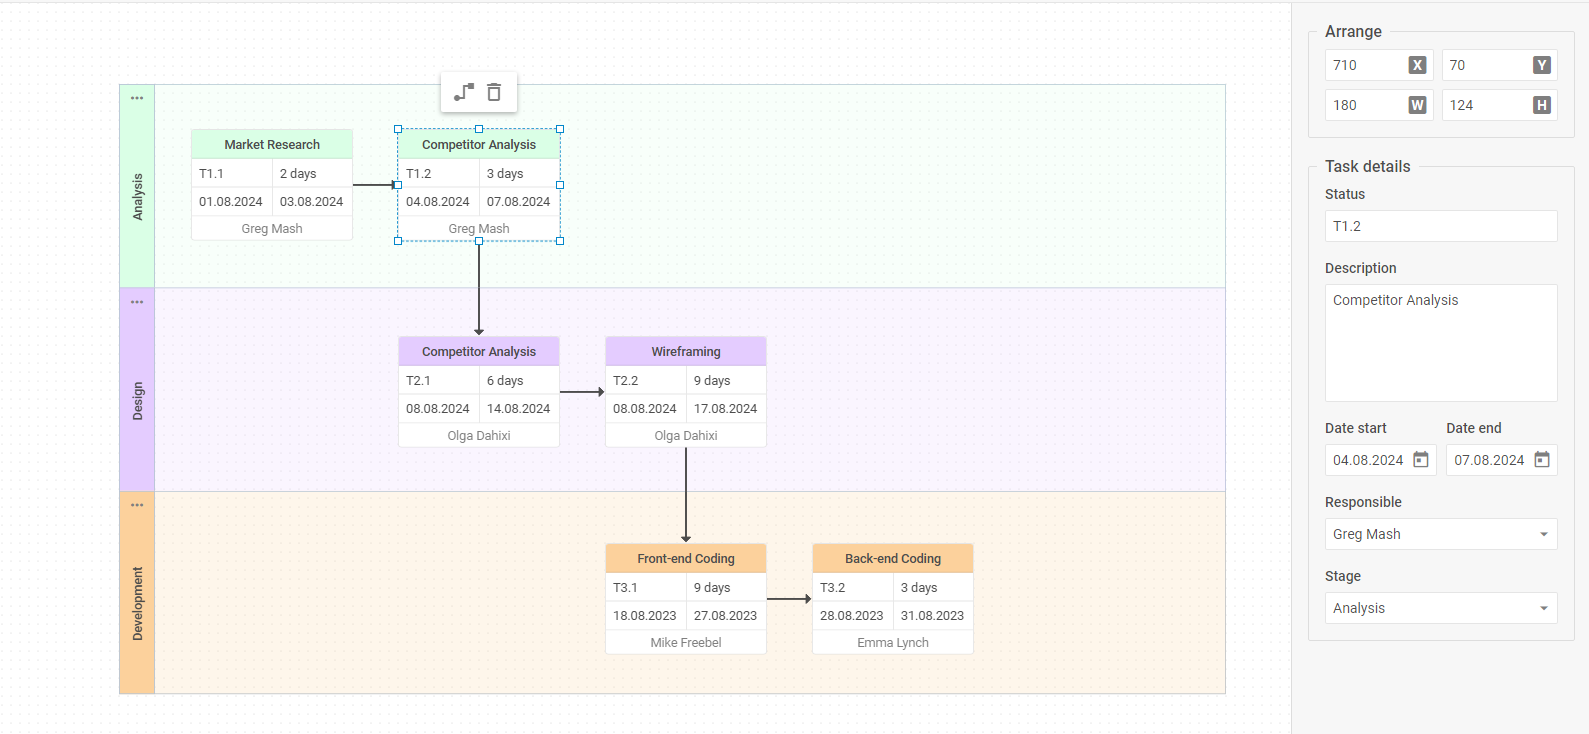
Editbar
The editbar section serves to separately adjust the visual appearance of key diagram elements to specific project requirements. It comes with a collection of editing controls for giving a selected diagram element (shape, connector line, group, swimlane) a new look. The number of available editing options for a specific item depends on its type and configuration. The panel is invoked when selecting the diagram element that you want to edit.
 Check the sample with the timeline diagram>
Using the editbar, you can perform the following operations:
- set a grid step for moving diagram elements,
- change shape parameters (positioning, size, stroke, color),
- modify attributes for groups and swimlanes,
- play around with text content,
- specify settings for connector lines.
More details on the sections described above can be found in Diagram editor guides.
Customization Options: How to Configure the DHTMLX JS Diagram Editor For a Specific Scenario
DHTMLX Diagram editor is notable not only for its straightforward and practical approach to data visualization, but also high adaptability to specific project requirements. When choosing our JavaScript diagramming component, developers get at their disposal a comprehensive API with an array of configuration and customization options to make the editor look and function as outlined in project requirements. Wonder how to customize a JavaScript diagram editor from DHTMLX? Let’s find out about possible transformations.
In the toolbar, you can adjust the default layout to specific needs by rearranging button groups, hiding unnecessary controls, and extending functionality with custom controls such as a button, input, datepicker, and more. For instance, it is possible to add a search bar for convenient work with large diagrams, or custom icons for specific actions, such as switching to the Dark theme or disabling edit mode.
 Check the sample with the custom toolbar search option>
Taking into account a variety of visualization scenarios that can be implemented in the default mode, the default shapebar may not address all the needs. Therefore, you are free to enrich the Shapebar with custom sections. New sections may contain various types of shapes (default, custom, mixed, or similar items with different settings) arranged in a particular order. Also, you can specify previews for default and custom diagram items.
 Check the sample with custom shapes in the shapebar>
The grid area is also adjustable to provide an optimal environment for manipulating diagram elements. For example, it can be configured in a more granular way by restricting user actions (e.g., disabling resizing, connecting points, grid, etc.) and modifying the overall workspace behavior. Also, you have an opportunity to customize personal toolbars for diagram items (shapes, diagrams, swimlanes).
 Check the sample with a custom personal toolbar>
The Editbar is the most powerful element of our JavaScript editor in terms of configuration and customization. Why so? Because it is the centerpiece of our JavaScript editor, which largely impacts the diagramming experience and its final result. Therefore, it comes with an extensive arsenal of customization options for any editing scenario. You can put into action a solid pack of controls (basic and complex), condition-based configuration adjustments, custom controls, and HTML content.
 Check the sample with custom editbar controls>
Concluding this section of our article, we should certainly mention the flexible styling of the DHTMLX Diagram editor. The overall appearance of the editor is easily modified via customizable built-in themes, while targeted styling changes in specific sections or their elements are introduced with CSS.
 Check the sample with basic and custom themes>
Thus, you get a fully customizable diagramming tool for web apps.
Why a JavaScript Diagram Editor Matters for Modern Business
Think back to the last industry survey or other business-oriented materials you came across. Was it only text? Almost certainly not. Today, data visualizations have evolved from being nice additions to essentials used by companies to streamline their internal and external communications.
Internally, businesses utilize various types of diagrams and infographics to present their corporate structure, simplify decision-making, generate innovative ideas, illustrate processes, prioritize activities, and more. Externally, visualizations can play a significant role in technical product presentations, market research, partnership proposals, and other endeavours.
Also, it is not rare to use diagramming functionalities in combination with other advanced tools. For instance, DHTMLX Diagram is used in a real project management app together with our JavaScript Gantt component. Moreover, we continue our path to making our product the best JavaScript diagram library and prepare great novelties for the next release of DHTMLX Diagram.
This broad adoption explains why businesses increasingly seek applications with built-in visualization capabilities like a JavaScript diagram editor.
DHTMLX vs Competitors: Best JavaScript Diagram Editors Compared
Now, let us review several JavaScript data visualization tools that provide live editing functionality and see how the DHTMLX Diagram editor stacks up against them by various criteria. We chose Rappid, yEd Live, and draw.io for this comparison.
| Criteria | DHTMLX Diagram Editor | Rappid | yEd Live | draw.io (diagrams.net) |
| Licensing terms | Commercial license required (free trial available) | Commercial license required (paid extension to the JointJS library) | Free to use as a standalone tool in browsers. Commercial yFiles license needed for embedding. | Desktop and online versions are free (under Apache 2.0 license) |
| Integration into apps | Fully embeddable. Designed for integration into enterprise web apps. | Fully embeddable in custom diagramming solutions | Not directly embeddable. To integrate similar functionality, developers must use the yFiles JS library (paid) | Embeddable via iframes |
| Customization | Highly customizable appearance and behavior of all editor elements | Can be customized to meet specific needs (requires more configuration effort) | Limited in yEd Live; high if using yFiles | Moderate (themes, shapes, limited toobar tweaks) |
| Documentation | Extensive and well-structured docs with API refs and multiple samples | Developer-focused docs + API | Basic documentation / help pages for using yEd Live | “Getting started” tutorials, FAQ, diagram examples |
| Support | Professional support from the vendor | Official tech support | Well-supported with a variety of resources | Official resource center |
| Business value | Saves the time and effort of dev teams when adding an editor to enterprise apps | Can be used for enterprise-grade solutions, but may require significant dev efforts at the start | Good for end-users who need quick visualizations | Suitable for building general-purpose diagrams with collaboration options |
Note: DHTMLX Diagram Editor is built on top of the DHTMLX Diagram library and provides a ready-to-use editing interface. That makes it directly comparable to end-user oriented editors such as draw.io and yEd Live.
Drag-and-drop JavaScript diagram editors can also be used by developers to explain different things with visuals in the documentation. In this case, you can consider Mermaid Live Editor (extension of the MermaidJS library), which helps quickly generate different types of diagrams with Markdown-inspired syntax.
As you can see, there is a good selection of live editors for achieving various visualization goals on the web, from free-to-use online diagramming tools to feature-packed solutions for enterprise-grade apps.
Conclusion: Why Choose DHTMLX JavaScript Diagram Editor
The diagram editor is rightly considered to be the key feature of our JavaScript diagram library. It gives web developers freedom to visualize data without coding, and at the same time enables end-users to show their skills in creating various types of diagrams. If you are looking for a user-friendly JavaScript diagram editor but still have doubts that our tool will cover all your needs, download a free 30-day trial version of the DHTMLX JavaScript diagram library to give it proper testing.
Bear in mind that the diagram editor is a part of the DHTMLX JavaScript Diagram component and cannot be purchased separately.
Related Materials:
- DHTMLX Diagram documentation
- DHTMLX Diagram code snippets
- How to create a JavaScript mindmap diagram with DHTMLX library
- How to create a data flow diagram in JavaScript with DHTMLX
- How to create a basic JavaScript entity relationship diagram with DHTMLX
- How to create a JavaScript tree diagram with DHTMLX
- How to create a JavaScript network diagram with DHTMLX