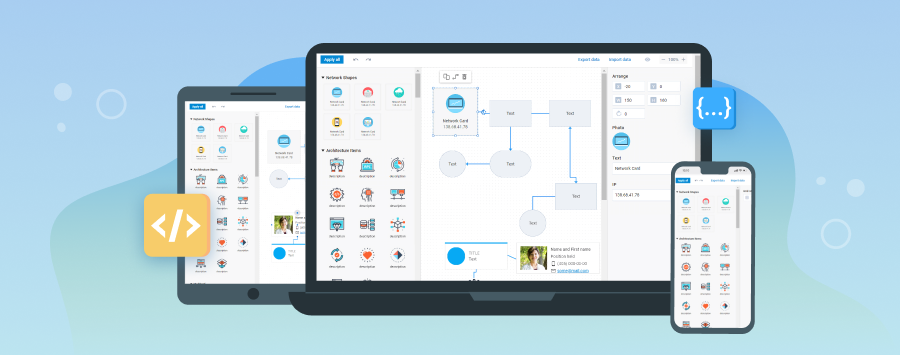
Providing regular updates with relevant features for our products is essential for both keeping our existing customers satisfied and staying competitive on the market. And we have no intention to slow down in this direction. In support of these words, we are happy to unveil the release of DHTMLX Diagram v4.2.
First of all, we have to say that our JavaScript diagramming component now offers touch support. Moreover, this minor update includes a pack of API changes to make your data visualization experience with DHTMLX even more convenient. For instance, now you can apply different syntax for specifying default configuration settings of connector lines in diagrams as well as in the Diagram Editor. It also became possible to display default sets of diagram elements in the left panel of the Diagram Editor and arrange them in a certain order.
Evaluate a new version of DHTMLX Diagram >
Let us have a closer look at the new features provided in v4.2.

Touch Support
For many business people, it has become a common thing to work with their enterprise software via smartphones or tablets with touch screens. It is not surprising that touch support is included in the technical specifications of almost any web project. Therefore, developers who rely on DHTMLX Diagram for visualizing data will be happy to know that our library is now touch-friendly. It will help to create JavaScript diagrams that can be accessed from any location using mobile devices.
Default Settings for Connector Lines in Diagrams
Over time, APIs of some functionalities require improvements. When preparing this DHTMLX Diagram release, we paid special attention to configuring connector lines that are used for linking shapes into a complete diagram structure.
Before v4.2, programmers used the defaultLinkType property for specifying default settings for connector lines. We deprecated this property and replaced it with lineConfig. It is an object that comes with the lineType parameter for setting the default type of a connector line.
lineConfig: {
lineType: "line"|"dash",
},
// other config parameters
});
Default Settings for Connector Lines in Diagram Editor
Starting from v4.2, the lineConfig property has also become a part of the Diagram Editor API. It deals with the default configuration which will be applied to new connector lines added via the Editor. There are three optional parameters included in the lineConfig object:
- lineType – defines the default type of connector lines with the line or dash values,
- lineDirection – defines the direction of connector lines with the forwardArrow or backArrow values,
- arrowsHidden – helps to hide arrows that show directions of connector lines by setting its boolean value to true.
type: "default",
lineConfig: {
lineType: "dash",
lineDirection: "backArrow",
arrowsHidden: true,
},
// other config parameters
});
The lineDirection and arrowsHidden parameters are applicable only in the default mode of the Editor.
Default Sets of Diagram Elements in Editor’s Left Panel
Web developers find it really useful to add custom shapes and create separate sections for them in the left panel of our Diagram Editor. That is why we decided to make one more step forward in this aspect. In v4.2, we introduced a new way for specifying default section sets of diagram elements in the left panel of the Diagram Editor.
We updated the shapeSections property that serves this purpose. This property is an object that includes a set of key:value pairs. Previously, it allowed depicting predefined flowchart shapes when setting the value to true. At the same time, configuring swimlanes or groups could be done only manually, which was very inconvenient for developers.
Now you can utilize new syntax (flowShapes, group, swimlane, org) for specifying corresponding default sections with predefined diagram elements and place them in the left panel in the desired order as follows:
shapeSections: {
"Swimlane": [{ swimlane: true }],
"Groups": [{ group: true }],
"Flowchart shapes": [{ flowShapes: true }],
"Org shapes and text": [{ org: true }, "text", "topic"]
},
});
Other Improvements
Our development team also updated the defaults property that was previously used for setting default attributes for diagram shapes only. In the new version of our Diagram component, this property allows preparing default attributes for both shapes and connector lines in diagrams as well as in the Editor.
type: "default",
lineConfig: {
lineType: "dash",
lineDirection: "backArrow",
},
defaults: {
"line": {
strokeWidth: 5,
}
}
});
You can learn more information about the novelties provided in this release by visiting the documentation page.
Don’t miss an opportunity to test all new diagramming capabilities by downloading a free 30-day trial version of the DHTMLX Diagram v4.2.
We also encourage our current customers to get acquainted with the latest version of our JavaScript diagram component via their Client’s Area.
If you have any questions about this minor update or new ideas on improving our product, feel free to use the comment section below for sharing your thoughts.