An organizational chart (or simply org chart) is one of the most widely used diagram types provided in our JavaScript diagramming component. Web developers integrate JavaScript org charts into business apps for graphically presenting a company’s corporate organization and its internal reporting structure using shapes linked together with lines in a hierarchical order (parent-child relationships). And if this functionality is a current objective on your project, you’ve opened the right page.
In this blog post, we will look through the core features of our diagram component aimed to achieve your data visualization goals and consider in more detail two approaches to building org charts with DHTMLX.
What to Expect from DHTMLX Diagram Library
First of all, let us review the core features of DHTMLX Diagram that are typical of our JavaScript products. The most noteworthy of them are the following:
- advanced performance in all modern browsers,
- integration with popular JavaScript frameworks (Angular, React, Vue.js),
- native experience on any touch devices,
- full UI localization,
- exporting to PDF, PNG, and JSON formats,
- TypeScript support for faster coding and improved code maintenance.
Now we move on to the central question of this post.
Approaches to Visualizing Company’s Structure with DHTMLX Diagram
DHTMLX Diagram is very flexible when it comes to visualizing hierarchical structures via various diagram types, including org charts. It allows adding org charts to a web project via coding or UI. At the programming level, it is possible to achieve this goal with an extensive and easy-to-use API. Alternatively, you can enrich your web app with the DHTMLX Diagram editor that will enable end-users to build an org chart and edit it on the fly.
Let us have a closer look at both of these approaches and analyze their main strengths in delivering org charts.
Diagram in Org Chart Mode
When using a traditional coding approach, there is a special org chart mode in DHTMLX Diagram designed to facilitate your coding efforts. It comes with a built-in algorithm that automatically arranges all chart elements in a parent-child hierarchy.
 Check the sample >
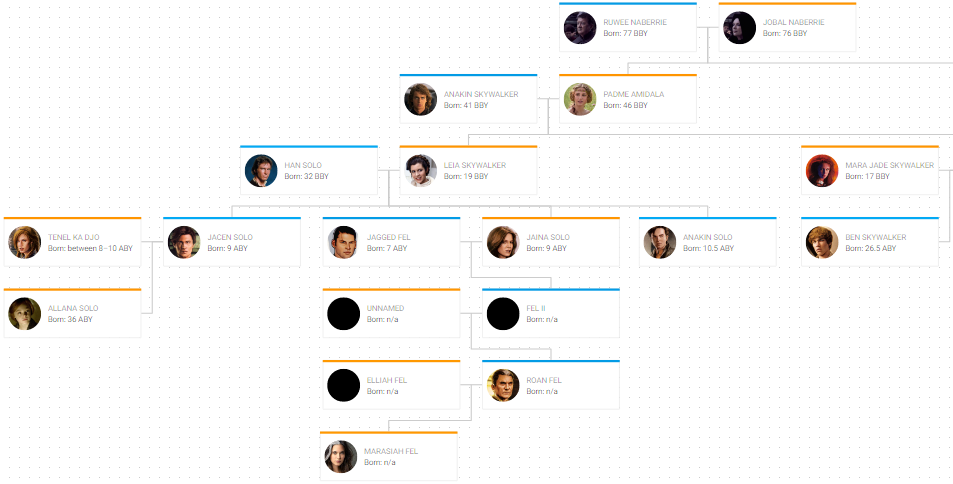
This mode is well suited for creating org charts as well as other tree diagrams (family trees, WBS diagrams, etc.).
 Check the sample >
Our JS diagram library provides plenty of features for building fully-functional org charts of any complexity. Moreover, here you can also make use of built-in shapes available in other Diagram modes and add to your project other types of shapes.
Simple Initialization
You can often hear that it is the first step that costs. Fortunately, it does not apply to the DHTMLX Diagram library. To add an org chart to your app, you’ll need to follow just a few simple steps: download the Diagram package and unpack it into your project folder, initialize the org chart, load data into the chart, and there you have it!
As for the actual initialization, it is performed with the help of the dhx.Diagram constructor. You can initialize your org chart in a container, in the document body, or in a layout cell. Here is an example with a container:
type: "org"
});
You can learn more details about the initialization process in this section of our documentation.
Quick Configuration for All Cards
One more thing that you will certainly like about DHTMLX Diagram is its flexible configuration. Our JavaScript component offers a large number of configuration options. But we would like to pay special attention to the defaults property that will help you to save time on preparing datasets for complex org charts and at the same time write less code. The thing is that this property enables you to set the default configuration for all cards of your chart at once.
For example, that is how you can configure the size for all cards:
height: 115,
width: 330
};
Visit this page to become familiar with other configuration options and see how they are applied in plain examples.
Custom Org Chart Elements
We are well aware that it is next to impossible to satisfy end-users’ expectations without a personalized approach to their needs. To give you more room for maneuver in this direction, we made the Diagram JS component maximally customizable. Thus, you are able to create your own org chart elements that comply with any project requirements.
Using the addShape method, you can quickly create a custom card and define a unique template for it, where all required attributes will be specified. This method also allows adding the default configuration of cards.
But before you embark on creating custom shapes, it is required to set up an HTML template for them:
<div class="dhx-diagram-demo_personal-card">
…
</div>
Then you can proceed with adding custom shapes:
template: template,
defaults: {
name: "Name and First name",
post: "Position held",
phone: "(405) 000-00-00",
mail: "some@mail.com",
photo: "../common/big_img/big-avatar-1.jpg",
height: 115, width: 330
},
});

By default, all org chart cards are linked with each other in a hierarchical order via basic “elbow” lines. But you can make them look different by applying required configuration properties in the line object like in the following example:
{
id: "1-2",
from: "1",
to: "2",
type: "line",
strokeType: "dash",
stroke: "red",
},
];

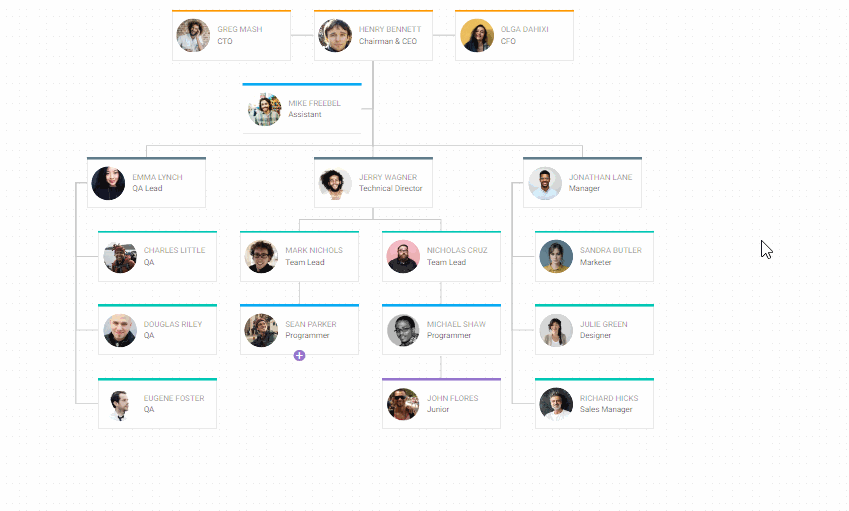
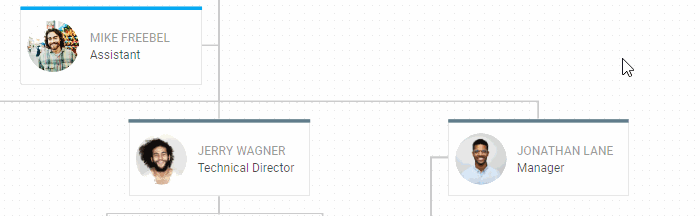
Assistant and Partner Shapes
If you face the problem of presenting assistants/secretaries or workers who are at the same level within the company structure, there is a solution. The DHTMLX diagram library gives you an opportunity to complement any parent node in the org chart with assistant and partner cards. The second option is also very useful for building family trees. Assistants and partners are added to the chart by preparing a data set using the same named properties:
{
"id": "1",
"text": "Chairman & CEO",
"title": "Henry Bennett",
"img": "../avatar-01.png"
},
// partner for 1
{
"id": "1.1",
"text": "CTO",
"title": "Greg Mash",
"img": "../avatar-17.jpg",
"partner": true,
"parent": "1",
},
// partner for 1
{
"id": "1.2",
"text": "CFO",
"title": "Olga Dahixi",
"img": "../avatar-23.jpg",
"partner": true,
"parent": "1",
},
// assistant for 1
{
"id": "1.3",
"text": "Assistant",
"title": "Mike Freebel",
"img": "../avatar-30.jpg",
"assistant": true,
"parent": "1",
},
];

Features for Convenient Working with Large Org Charts
When your org chart starts growing in complexity, it is necessary to think about adding some features that will help end-users conveniently work with big structures. The Diagram API includes a set of methods and properties designed to enable such functionality as:
- expanding/collapsing branches,
- filtering org chart items,
- adding a search bar,
- displaying a chart compactly in a vertical mode,
- scrolling to a specific card,
- zooming in/out the org chart structure.
All these and other features described above are well-documented in our guides, so there should be no difficulty in incorporating them into your app. In addition, you can also read this article to get the full picture of how the coding approach works in practice.
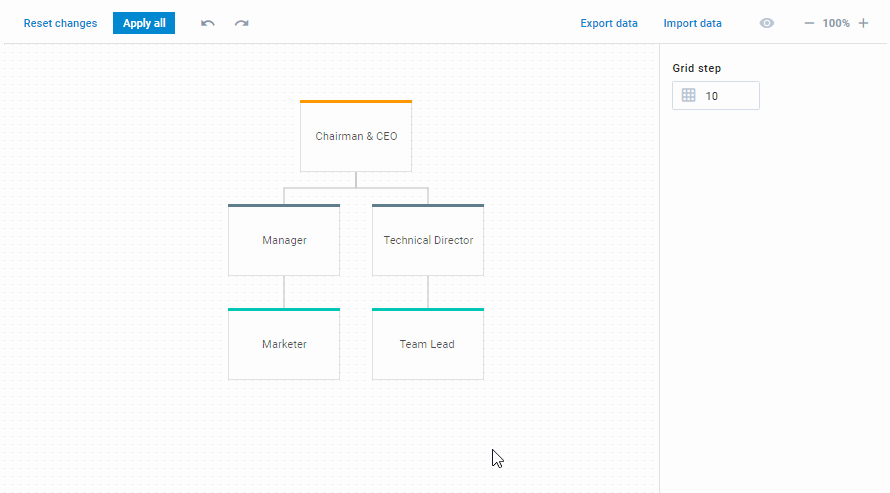
Benefits of Using DHTMLX Diagram Editor
DHTMLX Diagram Editor is a specifically-designed tool provided together with our diagram library that offers a code-free way to present various types of diagrams on a web page. Just like the DHTMLX Diagram, it offers three different operating modes – default, org chart, and mind map.
When using the org chart mode, end-users can depict org charts and other tree-like diagrams via an intuitive interface without worrying about its structural accuracy. The interface of the editor in the org chart mode consists of three main parts: toolbar, grid area, and right panel. All that is needed to engage in building an org chart is to select a root shape and start adding child items in the required order.
Sounds promising, right? But there are many other functional benefits in the editor’s interface to help you make the most of this tool. Let’s explore them right away.
Multifunctional Toolbar
The toolbar is a reliable instrument that provides full control over the editing process and comes to the rescue when something goes wrong. Placed at the top of the interface, it includes a pack of controls for performing various useful operations in the org chart mode of the editor.
 Check the sample >
For instance, all editing changes can be instantly applied to the org chart or removed with the help of “Apply All” and “Reset changes” buttons respectively. Undo and redo buttons will help in dealing with the most recent changes. The zooming function serves for effectively working with large charts. There is also a possibility to hide the right panel with a special control (editManager) and focus on the chart.
Numerous Options for Interacting with Cards
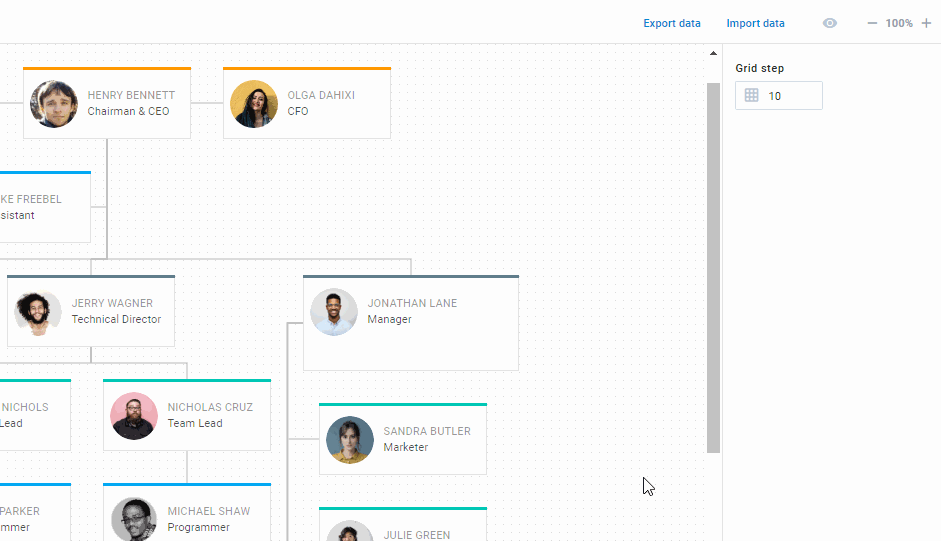
Although cards in the org chart are arranged in the grid area automatically, it is not a problem to move the whole chart or any card in the needed direction with drag-and-drop. But more interestingly, you can instantly change the structure of the chart manually by dragging one parent node (together with its children) to the other one. Such a necessity may arise in the case of corporate restructuring.
 Check the sample >
When clicking on a card in the grid area, you get access to additional capabilities for interacting with it via a personal toolbar. The list of options includes the following:
- adding a new card,
- adding assistants and partners,
- aligning children of a given card vertically or horizontally,
- deleting the selected card (except for the root one) with its children.
Personal toolbars of assistant and partner cards have just the “remove” option that deletes the selected card.
All cards are also equipped with handles for changing their size. Any card with child elements is collapsible/expandable. The multiselection function allows selecting several cards with the mouse or the hotkey combination (Shift+Left Click) and simultaneously performing basic operations on them (move, copy, paste, remove). The editor also supports a range of hotkeys for managing the org chart with the keyboard.
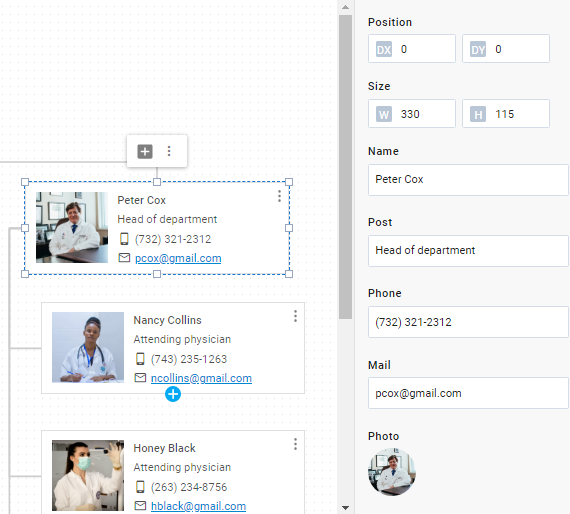
Editing Cards
After completing the structure of your org chart, you can proceed with modifying cards individually and filling them with relevant content. That’s where the right panel of the editor comes into action.
 Check the sample >
Editable options in the right panel appear on the screen after clicking on the wanted card. The right panel offers a set of editable card attributes such as grid step, position and size of the card, color of the card header, and employee’s personal information (full name, position, photo). Apart from that, predefined org chart shapes come with a built-in editor that allows changing text content right in the grid area. Users just have to double-click on the needed card attribute and update its value.
 Check the sample >
Editor Customization
Similar to the DHTMLX Diagram library, the editor also has powerful customization capabilities. First and foremost, it is related to the possibility to add custom cards to the editor. Such new cards can contain both default and unique attributes but it won’t limit the user’s ability to change any of them when needed. All custom parameters can be easily added to the right panel with the properties parameter of the addShape method to ensure that your org chart is fully editable.
 Check the sample >
There is also an opportunity to modify the way you interact with a card in the grid area by customizing its personal toolbar. Change how controls are arranged in the toolbar, remove unnecessary functions, add custom ones – all options are at your disposal. It is also possible to set a custom styling for the parent node to which some other parent node with its children is dragged.
 Check the sample >
The editor toolbar can be adjusted to specific requirements to facilitate more effective control of data visualization efforts.
 Check the sample >
As you can see, the DHTMLX Diagram editor has everything that’s needed for building custom org charts and other hierarchical structures.
Conclusion
DHTMLX Diagram allows you to combine two effective approaches for visualizing a company’s structure with minimum time and effort. You can either create and fine-tune a JavaScript org chart via a rich API or embed a feature-rich org chart editor to enable users to build DHTMLX-based org charts and other hierarchical structures via a user-friendly interface.
Have doubts about that? Download a free 30-day trial version and see for yourself.