We are excited to announce the first release of dhtmlxPivot – JavaScript pivot table. What is a pivot table? It is a table with advanced functionality that allows you to store the summary of a particular data set. It’s pretty useful in the case of seemingly endless numbers of records to be processed.
The version 1.0 introduces basic functionality and will mostly cover the needs of your business app. So, here are the main advantages of dhtmlxPivot 1.0:
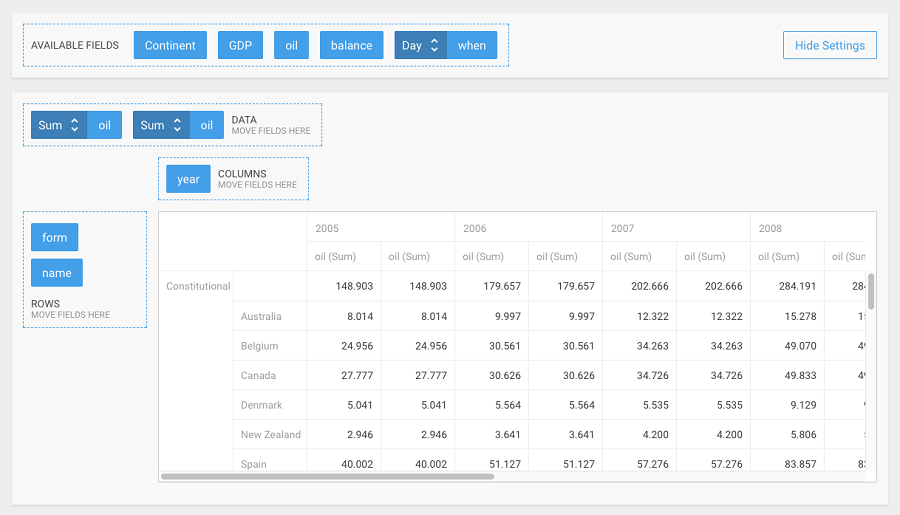
- A drag-and-drop oriented interface that allows using it with ease. You can simply summarize or rearrange the existing columns by dragging.
- Taking into account that pivot tables allow extracting the required data out of thousand of rows, incredibly fast rendering of dhtmlxPivot will be one of the main advantages.
- The Pivot component is fully configurable and customizable via its extensive API.
- You can embed DHX Pivot in your cross-browser app as the component works and renders equally well in all web browsers.

- There are few simple steps to start working with Pivot and integrate in your app.
- Localize the elements of the component and display them in the language you need.
What is the purpose of a pivot table?
Like any other table based app, a pivot table consists of rows and columns. Additionally, it contains user-specified data fields and pages. All these components can be moved through the table grid in order to help a user to group the particular data in real time. When a user specifies the value of a data-field, a pivot table can convert the header of each column into a data option which can be manipulated by a user. There’s also a possibility to display different summaries of data such as frequencies and averages.
Related links:
Note: dhtmlxPivot is a standalone component and isn’t included in dhtmlxSuite library.
dhtmlxPivot can provide you with a more efficient way of reports creation. Freeing you from hours of routine work, it allows extracting the portions of data according to a particular criterion. Such feature allows automating dozens of repetitive operations with data. You can analyze the data consisting of thousands of records with ease and arrive at quick decisions.
The component will be constantly improved and receive new features soon. We’ll be glad to receive feedback from the first users of our new component. And you are always welcome to send your feature requests and other suggestions.