We’re happy to announce a new series of our video tutorials devoted to the configuration of DHTMLX Gantt chart!
In the first video from our series, we’ll show you how to specify columns of the left-hand grid and give you a small overview of templating and formatting functions in dhtmlxGantt:
The columns of the grid in a Gantt chart are specified as an array of objects inside the ‘columns’ config.
A typical configuration can look like this:
{name: "text", tree: true, width: '*', resize: true},
{name: "start_date", align: "center", resize: true},
{name: "duration", align: "center"},
{name: "add", width: 44}
];
In fact, this is the configuration you’ll have by default even if you don’t specify this setting in your app.
Columns have quite a lot of optional properties. An important thing to know is that only the ‘name’ property is mandatory. Its main purpose is to define the content of cells. By default, the cell will take the value from the matching property of the task:
gantt.config.columns = [
{name: "text", tree: true, width: '*', resize: true},
{name: "start_date", align: "center", resize: true},
{name: "duration", align: "center"},
{name: "add", width: 44}
];
gantt.init("gantt_here");
gantt.parse({
data: [
{
id: 1, text: "Project #2", start_date: "01-04-2018", duration: 18, order: 10,
progress: 0.4, open: true
},
{
id: 2, text: "Task #1", start_date: "02-04-2018", duration: 8, order: 10,
progress: 0.6, parent: 1
},
{
id: 3, text: "Task #2", start_date: "11-04-2018", duration: 8, order: 20,
progress: 0.6, parent: 1
}
],
links: [
{id: 1, source: 1, target: 2, type: "1"},
{id: 2, source: 2, target: 3, type: "0"}
]
});
});
As you can see in our example above, the column named ‘text’ displays values from the ‘text’ property of the task object. The same applies to the start date and duration.
The only exception is the column named ‘add’ – it’s a predefined value that displays the ‘+’ sign which allows users to add children for the task.
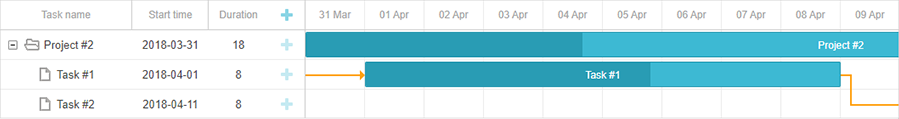 Basic Grid configuration in DHTMLX Gantt
Based on that, you can specify your own columns. For example, to define four custom columns in the grid such as ‘Task name’, ‘Holder’, ‘Start Time’, and ‘Progress’, we should specify the columns parameter, where ‘text’, ‘holder’, ‘start_date’, and ‘progress’ are the names of the data properties.
{name:"text", label:"Task name", tree:true, width: 150 },
{name:"holder", label:"Holder", align:"center", width: 80 },
{name:"start_date", label:"Start time", align:"center", width: 80 },
{name:"progress", label:"Progress", align:"center", width: 80 },
];
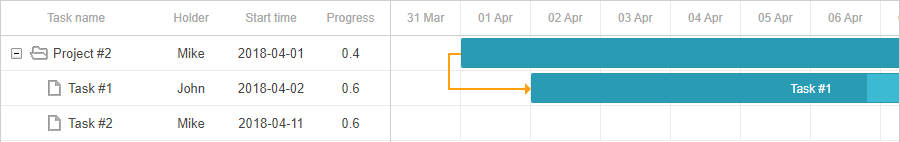 Custom columns in the grid of dhtmlxGantt
But what if you want to format values before displaying them inside cells? In this case, you’ll need to use the ‘template’ property of the column. Here is how our previous example can look like if we use the template in it:
{name:"text", label:"Task name", tree:true, width:"*" },
{name:"start_date", label:"Start time", align: "center" },
{name:"staff", label:"Holder(s)", template:function(obj){
return obj.holder+"("+obj.progress")"} }
];
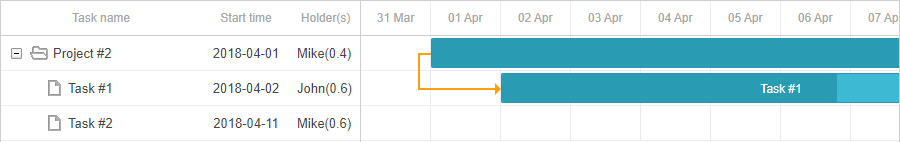 The template property in dhtmlxGantt
The template will be called each time the column is repainted and the return value will be put into the inner HTML of the cell. This is an important trait of almost all templates used in the Gantt chart. The content of the templated element is completely replaced after each update. It means that if you modify such DOM element directly from code, all your changes will be lost after the template is called next time.
Therefore, if you need to change the type of the cell line in response to a user action, the best way is not to change styles directly, but to set the necessary styles and markup using the template function.
{name:"text", label:"Task name", tree:true, template(task){
if(gantt.getState().selected_task == task.id){
return "<b>" + task.text + "</b>";
}else{
return task.text;
};
} },
{name:"start_date", label:"Start time", align: "center" },
{name:"staff", label:"Holder(s)", template:function(obj){
return obj.holder+"("+obj.progress+")"} }
];
Secondly, it’s important to note that templates deal with raw HTML values and don’t sanitize data you return from them in any way. It’s a conscious design decision, which allows you to freely customize most of the Gantt elements. But it has one serious consequence – such templates can serve as entry points for XSS attacks. Let’s consider the next example:
gantt.config.columns = [
{name:"text", label:"Task name", tree:true, template(task){
if(gantt.getState().selected_task == task.id){
return "<b>" + task.text + "</b>";
}else{
return task.text;
};
} },
{name:"start_date", label:"Start time", align: "center" },
{name:"staff", label:"Holder(s)", template:function(obj){
return obj.holder+"("+obj.progress+")"} }
];
gantt.init("gantt_here");
gantt.parse({
data: [
{
id: 1, text: "<img onerror='javascript:alert(\"it can`t be good\")' src='' />", start_date: "01-04-2018", duration: 18,
progress: 0.4, holder:"Mike", open: true
},
{
id: 2, text: "Task #1", start_date: "02-04-2018", duration: 8,
progress: 0.6, holder:"John", parent: 1
},
{
id: 3, text: "Task #2", start_date: "11-04-2018", duration: 8,
progress: 0.6, holder:"Mike", parent: 1
}
],
links: [
{id: 1, source: 1, target: 2, type: "1"},
{id: 2, source: 2, target: 3, type: "0"}
]
});
});
It’s the same date as before, but this time we’ve added a certain HTML string into the task text. Now, look at what happens when we run the example. The javascript code that we’ve put in the data has been executed on the page. If the backend of a real application returned such data, that code would run in browsers of every user who would open this project. These types of attacks are often used to inject malicious code into an application in order to steal any sensitive data or change the content of your page. It’s a responsibility of a backend developer to ensure that the data feed returns data without unsafe HTML in it. Once you ensure your data source is secure and can be trusted, Gantt templates are perfectly safe.
In addition, to be able to set the Grid configuration, you can also change it dynamically. For example, if you want to give a user an ability to switch between detailed and compact Grid views.
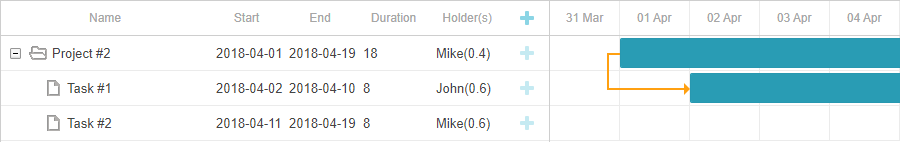 Detailed view of the grid in Gantt
You can do it simply by assigning a new value to the columns config and repainting Gantt.
var largeGrid = [
{name: "text", label:"Name", tree:true, width: 200 },
{name: "start_date", label:"Start", align: "center", width: 70 },
{name: "end_date", label:"End", width: 70 },
{name: "duration", label:"Duration", width: 70 },
{name: "staff", label:"Holder(s)", template:function(obj){
return obj.holder+"("+obj.progress+")"}, width: 70 },
{name: "add", width: 44}
];
var largeGridWidth = 550;
var smallGrid = [
{name: "text", label:"Task name", tree:true, width: 200 },
{name: "start_date", label:"Start time", align: "center", width: 70 },
{name: "staff", label:"Holder(s)", template:function(obj){
return obj.holder+"("+obj.progress+")"}, width: 70 }
];
var smallGridWidth = 340;
gantt.toggleGrid = function(){
var newGrid;
var newGridWidth;
if(gantt.config.columns == largeGrid){
newGrid = smallGrid;
newGridWidth = smallGridWidth
}else{
newGrid = largeGrid;
newGridWidth = largeGridWidth;
}
gantt.config.columns = newGrid;
gantt.config.grid_width = newGridWidth;
gantt.render();
};
gantt.config.columns = smallGrid;
gantt.config.grid_width = smallGridWidth;
gantt.init("gantt_here");
If you’d like to try to configure a grid of the Gantt chart on your own, just follow these steps:
- Get a free 30-day trial version
- Watch our video tutorial
Hope this tutorial will come in useful for you! Don’t hesitate to leave your comments below if you have any questions.
Check other video tutorials by DHTMLX: