Presenting data in visual form allows absorbing information better. Different types of sophisticated lists, schedules, or measurements can be more understandable if we turn them into the charts or infographics. But when we talk about the online applications that were developed to visualize the data in some graphic way, we may need something more than a simple picture that represents the state of affairs.
Gantt chart is probably one of the most common ways to visualize the workflow in easy to grasp way. And when it comes to the project management process, we usually face the need for rapid changes. If a task completion was delayed, we have to show it on the chart. To track the current progress, we have to change the task completion percentage from time to time. These and many other issues demand the additional functionality from a Gantt chart applications.
In this article, we decided to explore most popular d3.js Gantt charts. The aim is to learn what’s this, possible use cases and gantt chart examples that can compete with our JavaScript/HTML5 Gantt chart – dhtmlxGantt, and surely to make a conclusion that all the solutions have the right to exist.
Download dhtmlxGantt Professional Edition
Basic Example of D3.js Gantt Chart
Reference: you may find GitHub repo here
Let’s start with the basics to see, how you can use D3.js to build a Gantt chart. First of all, you have to create some data to visualize:
{
"startDate": new Date("Sun Dec 09 01:36:45 EST 2012"),
"endDate": new Date("Sun Dec 09 02:36:45 EST 2012"),
"taskName": "E Job",
"status": "FAILED"
},
{ /* second task */}];
Optionally, you can use CSS for styling the different types of tasks according to the status, task name, etc:
"SUCCEEDED": "bar",
"FAILED": "bar-failed",
};
/* other task statuses */
.bar {
fill: #33b5e5;
}
.bar-failed {
fill: #CC0000;
}
Using the task names, you can create an array of task names that will be used fro grouping the tasks:
Finally, we can gather together all that you’ve done before for creating a Gantt chart:
gantt(tasks);
As a result you’ll get something like this:
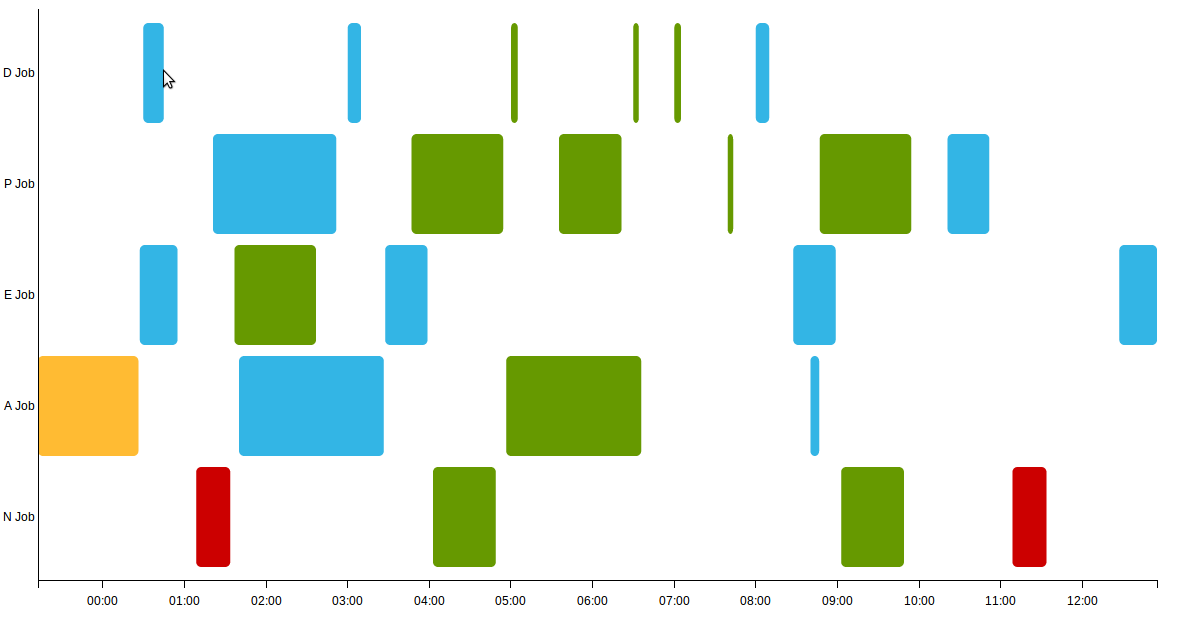
As you can see, the resulting application looks pretty neat and colorful. It can be pretty useful for visualizing some parallel activities. But the everyday experience of managing the more or less complex projects tells us that the ability to add and remove tasks and change the time scale can be pretty helpful. Of course, D3.js doesn’t limit your imagination, and you can add to your applications as many features as you want. You can use buttons for adding or removing the activities, and the zooming feature that allows changing the view from the whole project to the separate tasks:
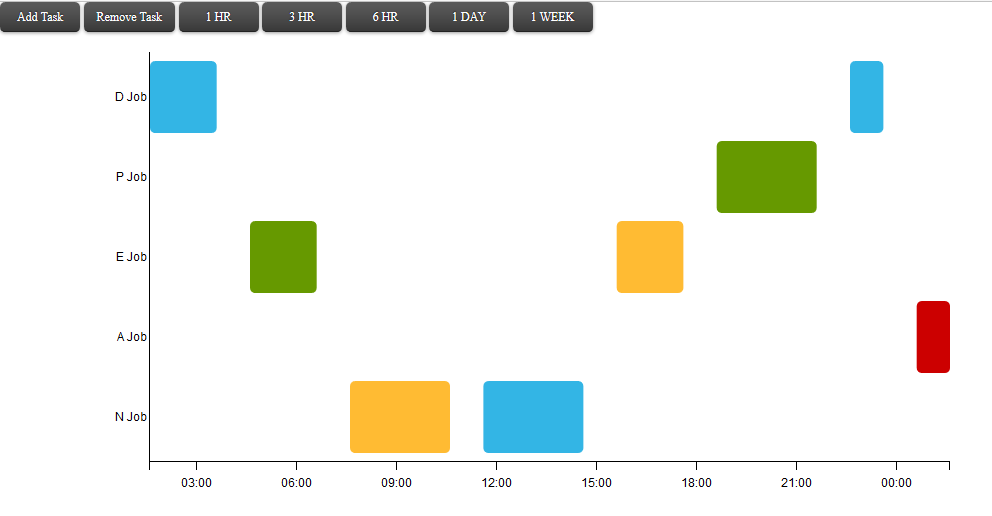
Unfortunately, the amount of code deserves a separate article. But you can visit this example page to see how everything works and check the scale of the required efforts.
As you can see, the developer must do considerable work to implement the features that work out-of-the-box in full-featured Gantt charts. Imagine how hard it will be to add the links between the tasks, milestones, the possibility to move and the tasks, and other handy features. Definitely, it’ll take some time. Luckily, you can use D3.js based libraries to simplify and speed up the development process.
D3 Gantt Chart Libraries
Despite the fact that there are not so much of Gantt chart libraries that are based on D3.js, you can always find one or two if you want to. For example, let’s talk about the Alampros Gantt Chart.
This library allows you to add such elements like milestones and datelines that provide the user with the possibility draw a line in the Gantt chart to point a relevant day. Gantt chart can handle task overlapping and dynamically resize category axis tick ranges. When a taskbar does not totally fit on the current time domain, it is drawn partially. You can use multiple charts on the same page. Progress percentage can be assigned to each task, a bar within task rectangle is drawn to show it. Using the categories you can group the existing tasks. You can use styling as well.
As you can see, the very basic set of features can be available to you with this library. And it’s definitely easily to create a working Gantt chart online application using it rather than the “raw” D3.js. But you won’t find here any of the advanced features like critical path, for example. The absence of rich API and detailed documentation make us think that it will be a long road to adulthood before the Alampros Gantt Chart can compete with more advanced solutions.
Conclusions
Beyond all doubts, D3.js is a great tool that has almost no restrictions on the use when it comes to the data visualization. But it is better to consider it as a tool for creating tools. Our team also loves its smooth and beautiful animation. But the lack of diversity of Gantt chart libraries that are based on D3.js doesn’t look encouraging. If you plan to create your own library for data visualization, you can consider D3.js as one of your options. Without a doubt, with the necessary skills you can create a library that will be able to represent the data in the form of beautiful and colorful visualizations. But if your intention is high-performance online Gantt chart application with tons of features that work out-of-the-box or can be added with ease, you’d better check more advanced solutions like dhtmlxGantt.