When you claim that your product comes with advanced customization capabilities, be sure that customers will give it a harsh test. This rule is certainly applicable to DHTMLX Gantt. Our support team receives many requests on how to implement certain appearance customizations in our JavaScript Gantt component.
We combined several popular requests into one case and would like to show you how these customizations are implemented in practice.
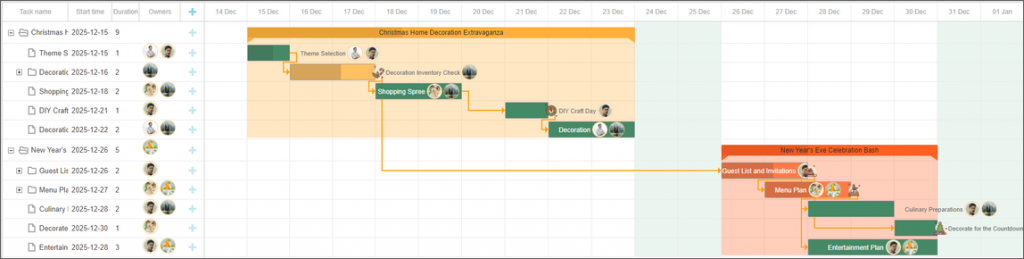
Use Case: JavaScript Gantt Chart with Custom Project Tasks, Resources, Icons, and More
DHTMLX Gantt comes with a comprehensive API that enables you to adjust the default view of our JavaScript component to your liking and any HTML elements to the timeline as in the example below:
Check the code snippet >
This JavaScript Gantt chart includes numerous customizations delivered with DHTMLX Gantt. Here, we changed the look of project tasks, specified resources in the grid as well as in the timeline, added the ability to show task names and resource images inside task bars, highlighted weekends and regular tasks belonging to a particular project, and placed custom icons on top of tasks.
Such customizations will make it much easier for end-users to manage the workflow and keep track of resource distribution. So without further ado, let us provide you with more details on how to add such features to your Gantt project.
Project Task Bars with Custom Brackets
In Gantt charts, it can be useful to display projects with special brackets (triangles) that indicate the projects’ start and end dates. By default, DHTMLX Gantt shows all tasks (including projects) as rectangles, and there is no such built-in feature for emphasizing the timeframe in project tasks. However, the rich API of our Gantt allows you to add such elements to a web project.
For instance, it can be done via gantt.config.type_renderers. Using this config, you can completely redefine the appearance of tasks. We also have an official sample on the subject. This option offers plenty of customization opportunities, but it also causes some inconvenience. The thing is that when creating custom elements, you’ll have to manually add HTML-elements with particular classes and properties or event handlers for some existing Gantt features such as handlers for adding dependencies or a progress bar, otherwise they won’t work.
But don’t worry, there are two other ways to solve this task. The first one of them is to use an additional layer that allows displaying any HTML elements in the Gantt timeline.
Another more convenient approach for adding custom brackets is to apply CSS. You can do it using ::before and ::after pseudo-elements.
They will have the following common styles:
.gantt_project::after {
content: "";
position: absolute;
top: 100%;
background-color: transparent;
border-style: solid;
}
Custom brackets are drawn with the border property, but you need to add the border-width parameter in the style rules:
left: -1px;
border-width: 0px 0px var(--gantt-bracket-height) var(--gantt-bracket-width);
}
.gantt_project::after {
right: 0px;
border-width: 0px var(--gantt-bracket-width) var(--gantt-bracket-height) 0px;
}
Since each project will have a different color, you will need to generate styles based on the project colors. For this purpose, iterate through each task and see if it is a project and has the color parameter. If so, you should add styles to the ::before and ::after pseudo-elements. The name of the class will be the following combination: “task + task ID”.
gantt.eachTask(function (task) {
if (task.type == gantt.config.types.project && task.color) {
dynamicStyle.innerHTML += `
.task_${task.id}.gantt_project::before{
border-color: transparent transparent transparent ${task.color};
}
.task_${task.id}.gantt_project::after {
border-color: transparent ${task.color} transparent transparent;
}
`;
}
})
document.body.appendChild(dynamicStyle);
It is also necessary to apply the task_class template to return a custom class, in which you need to check the task type. If it is a project type, add classic_project to the variable. Also, check whether the task has the color property, and if so, add task + task ID to the variable. After that, you should return a variable with all custom class names.
if (task.type == gantt.config.types.project) {
let css = "classic_project";
if (task.color) {
css += ` task_${task.id}`;
}
return css;
}
}
There is one more condition to make everything work smoothly. It is the height of project elements. By default, task bars can be stretched to almost the entire available row height. It means that you need to reduce the height of the task bar to show corners in the project bar. You can do it using the bar_height parameter that should be specified for projects.
"bar_height": 20,
Please note, that if you don’t do that, brackets in project tasks will extend beyond the task boundaries and will be displayed on the row below.
Assigning Resources to Tasks
The next feature is the ability to assign resources (in our case employees) to tasks. Our Gantt is known for wide resource management capabilities, including a separate resource panel.
But if you need a simpler configuration with individual elements, you can work with resources in a simplified form.
In our demo, we have an array, where names and photos of employees are specified. It is implied that such data can be loaded from the server.
{ "key": "1", "label": "John" },
{ "key": "2", "label": "Mike" },
{ "key": "3", "label": "Anna" },
{ "key": "4", "label": "Bill" },
{ "key": "5", "label": "Floe" },
]
Our Gantt has a lightbox section that enables you to assign several resources to one task and specify the resource value (hours, days, materials, etc.). To make it work properly, you need to specify an array with resources in the options parameter.
If the simple Gantt configuration is used (gantt.config.resources) and resources are loaded from the server using the load() or parse() method, Gantt will automatically add the necessary parameters to the lightbox section.
When using the custom configuration, the array must contain objects with the key and label parameters.
In our demo, we also show resources (photos of employees) assigned to tasks in the grid section. To do that, you need to use the template function of the column configuration, in which the value of the getOwnerPics function will be returned.
return getOwnerPics(task);
}
In this function, it is necessary to use the owners task property, where assigned resources are indicated. If there are assignments, you should add the resource ID to a separate owners array.
The next step is to iterate through the array with the resource data. If the resource ID is in the owners array, take the property with the photo and add it to the images variable. After that, you return this variable containing all photos of employees.
let images = "";
const owners = [];
(task.owners || []).forEach(function (el) {
owners.push(el.resource_id);
})
resourceData.forEach(function (resource) {
if (owners.indexOf(resource.key) > -1) {
images += " " + resource.img || "";
}
})
return images;
}
Task Names and Resources inside Task Bars
If you take a look at our Gantt demo, you can see that some task bars are displayed with task names and resource images inside them. If they do not fit in there, these elements will be displayed to the right of the task bar.
To determine if the task name and employee’s image can be placed inside the task bar, you are required to apply the detectOverflow function. In this function, you first use the getTaskPosition() method to get the coordinates of the task bar. Since you need only the width of the task bar, take the width parameter from the object returned by the getTaskPosition() method.
Then it is required to create the canvas element. Use the getComputedStyle() method to find out the font family and font size of the text that is usually displayed in the task bar. After that, specify these parameters in the context element and use the measureText() method to determine the text width.
const context = canvas.getContext("2d");
const bar = document.querySelector(".gantt_task_content")
if (bar) {
const fontFamily = getComputedStyle(bar)['font-family'];
const fontSize = getComputedStyle(bar)['font-size'];
context.font = fontSize + ' ' + fontFamily;
}
const textWidth = context.measureText(task.text).width;
Now it is time to add photos to the task bar. You have to specify the width of these photos to do that. In our demo, the width of images is adjusted to the height of task bars, so you can use the value of the gantt.config.row_height config. But if the width of the elements is different, you’ll need to set a new value. The width value must be multiplied by the number of resources assigned to a given task.
Now, it is necessary to sum up the width values of text and images. If the resulting value is greater than the width of the task bar, you return true. It means that the content (text + photo) won’t be included in the task bar.
return true;
}
If detectOverflow returns false, the task_text template contains the following condition. If the task type is a project, you will simply return the task text. If it is a regular task, return an HTML element with the task text and employees’ photos that you can get from the getOwnerPics function.
if (detectOverflow(task)) {
return ""
}
else {
if (task.type == gantt.config.types.project) {
return task.text;
}
else {
return `<span style="vertical-align: top" >${task.text}</span>${getOwnerPics(task)}`;
}
}
};
In the rightside_text template, use the detectOverflow function for tasks with the “task” type. If this function returns true, you should return an HTML element with the task text and employees’ images from the getOwnerPics function.
In DHTMLX Gantt, it is possible to use only one template. You can’t specify different templates multiple times and expect them to work properly. So you have to add all the code inside one template:
if (task.type == gantt.config.types.project) {
return `<div class='project-right' style="${getTriangleStyles(task, "right")}"></div>`
}
if (detectOverflow(task)) {
return `<span style="vertical-align: top" >${task.text}</span>${getOwnerPics(task)}`;
}
return "";
};
Highlighting Project’s Tasks and Weekends
When managing projects via a JavaScript Gantt chart built with DHTMLX, it can be useful to be able to highlight groups of tasks belonging to separate projects as well as weekends.
Let’s start by highlighting the project’s tasks. To enable this feature, you need to apply an additional layer that is drawn depending on the task coordinates. But before that, check if the task type is a project.
if (task.type == "project") {
Use the getTaskPosition() method to get the project coordinates. The topmost coordinate is already known – the top parameter in the sizes object.
Add the leftmost task coordinates to the left array and the rightmost coordinates to the right array, then iterate through each subtask of the project and add these coordinates. Also, increase the height parameter in the sizes object depending on the coordinates of the subtask.
const right = [sizes.left + sizes.width];
gantt.eachTask(function (child) {
const childSizes = gantt.getTaskPosition(child, child.start_date, child.end_date);
left.push(childSizes.left)
right.push(childSizes.left + childSizes.width)
if (sizes.height < childSizes.top + childSizes.height) sizes.height = childSizes.top + childSizes.height - sizes.top
}, task.id);
After iterating through all the tasks, you have to sort the left array to get the minimum value, and then add it to the left parameter of the sizes object.
Next, sort the right array, but don’t add the rightmost value to the right parameter of the sizes object. Instead, subtract the leftmost coordinate from the resulting value to get the width of the rectangle.
sizes.width = mostRight - sizes.left
Then, you need to create an HTML element and take its coordinates from the sizes object. In styles, specify the color from the project’s color parameter. If you do not specify the color, it will be set to gray by default.
When it comes to highlighting weekends, you should apply the timeline_cell_class template. Here, you should check if there is a date in the array with weekends, and if so, return a custom class name.
+new Date(2025, 11, 24),
+new Date(2025, 11, 25),
+new Date(2025, 11, 31),
+new Date(2026, 0, 1),
]
gantt.templates.timeline_cell_class = function (task, date) {
if (weekends.indexOf(+date) > -1) {
return "weekend";
}
};
Custom Icons on Top of Tasks
And finally, we want to share with you how to display custom icons on top of tasks. An easy way to do that is to make use of the addTaskLayer() method. With this method, you can check if the task has the icon parameter, which will indicate whether the task has a custom icon. It is a custom task property that we added to our demo project.
if (task.type == "project") {
After that, let’s take the coordinates of the task using the getTaskPosition() method. Then, create an HTML element, specify an image from an array with icons depending on the icon parameter, and set styles.
const img = document.createElement('img');
img.src = icons[task.icon - 1]
img.style = `
left: ${sizes.left - 10}px;
width: 30px;
top: ${sizes.top}px;
height: 30px;
margin-top: 2px;
position: absolute;
border-radius: 2px;
color: white;
opacity: 0.9;
z-index:1;
pointer-events: none;
return img;
That’s it. Following the instructions above, you can implement the key custom Gantt features like in our sample and add them to your project.
Wrapping Up
Delivering a Gantt app is never a trifling matter, especially if it must include numerous customizations. We hope that this blog post will be one more useful addition to your arsenal of Gantt customization options and, if necessary, you’ll easily integrate similar features into your app. Ready to share your unique Gantt customization scenarios? Send your ideas to us and we might choose it for one of our future articles.
Related Materials:
- Building a Jira-Like Project Roadmap with DHTMLX Gantt
- Deep DHTMLX Gantt Customization: Project Roadmap with Split Tasks and Milestones Organized via Swimlanes
- Deep DHTMLX Gantt Customization: New Looks of Tasks, Month Marker, and Customized Grid
- 200+ Code Snippets with DHTMLX Gantt
- DHTMLX Gantt Documentation
- 100+ DHTMLX Gantt Samples
- 30-day Free Trial Version