Creating a consistent and appealing visual style is an important requirement in any project management app. That is why we continue exploring this kind of customization in our JavaScript Gantt Chart library in the newly launched series of publications dedicated to this topic.
In this blog post, we will consider a new Gantt customization scenario requested by one of our customers, where our Gantt component is used for creating a project roadmap.
Use Case: Project Roadmap with Custom Time Scales, Split Tasks, and Text Labels
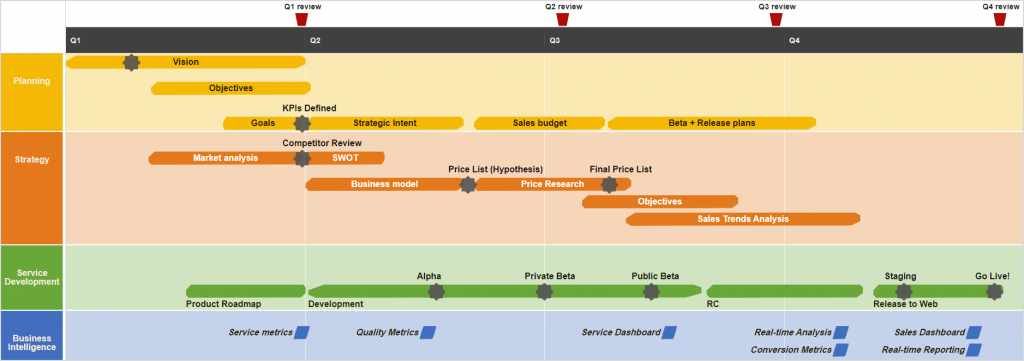
DHTMLX Gantt is commonly used in project management apps for detailed project scheduling and management, but it can also be adapted for building a project roadmap like in the example below.
Our customer asked us to create a sample similar to the swimlane PowerPoint template based on the Office Timeline Pro Add-in.
This roadmap provides a high-level overview of project’s goals and major deliverables (tasks, milestones) on a timeline. As you can see, we added swimlanes to visualize the workflow in this demo. Swimlanes help to clearly divide tasks and milestones into different phases of a product roadmap.
But the most notable part of this demo lies in several custom changes delivered by our team. Here we are talking about the upper scale of the Gantt timeline, usage of split tasks (split mode), shapes of taskbars, and multiple options for displaying text content for taskbars.
Let us discuss the implementation of these customizations at the programming level.
Customization Guide
Time Scales and Markers
We start with scales and markers at the top of the Gantt chart. The configuration of scales is specified using the scales property. We included two scale objects in the array of the scales config. These objects come with the unit property, where the corresponding “year” and “quarter” scales are specified.
{
unit: "year", step: 1, date: function (date) {
const markerDates = [
new Date("2025-03-28"),
new Date("2025-07-05"),
new Date("2025-09-25"),
new Date("2025-12-20"),
];
const markers = [];
markerDates.forEach(function (markerDate, index) {
markers.push(`<span class="scale_label" style="left:${gantt.posFromDate(markerDate)}px">Q${index + 1} review</span><div class="scale_marker" style="left:${gantt.posFromDate(markerDate)}px"></div>`)
})
return markers.join("")
}
},
{
unit: "quarter", step: 1, date: function (date) {
// console.log(date, (new Date(date).getMonth() % 3 + 1))
return "Q" + (new Date(date).getMonth() / 3 + 1)
}
},
];
In the upper “year” scale, we also added custom markers. To do that, it is required to determine the marker’s position using the posFromDate() method and specify this position with the left CSS property.
Project Phases with Split Tasks
Now we proceed to the most interesting part of this scenario, namely displaying project phases with split tasks in the timeline. There are four main (parent) tasks (Planning, Strategy, Service Development, and Business Intelligence), which are split into subtasks (child tasks) that are shown in the same row.
To enable the split mode for a certain task, we usually have to set its render property to split. But the current version of DHTMLX Gantt does not have a built-in ability to display split tasks in different vertical positions. Therefore, we had to come up with a custom solution. For each task, we added the level parameter, where we used variables from 1 to 4 to indicate its position.
Depending on the value in this parameter, different class names are returned in the task_class template. The position of tasks is determined with CSS styles (margin-top parameter). In the task_class template, we also specify where the task text should be displayed.
const css = [];
if (task.level) {
css.push("level_" + task.level)
}
if (task.type == "skew") {
css.push("skew")
}
if (task.text_position) {
css.push("text_position_" + task.text_position)
}
css.push(styleFromParent(task.parent))
return css.join(" ");
};
This Gantt scenario does not require the ability to create task dependencies and change task progress, therefore we disable these features in this scenario.
gantt.config.drag_progress = false;
Shapes of Subtasks
Subtasks (child split tasks) in the timeline have shapes of polygons and octagons instead of regular rectangles and diamonds. Shapes of tasks are modified with CSS styles. For instance, split tasks in the form of polygons are made with the clip-path property. This property is used for creating complex shapes in CSS.
clip-path: polygon(50% 0%, 98% 0, 100% 21%, 100% 65%, 96% 98%, 2% 100%, 0 77%, 0% 43%, 4% 0);
}
Text Labels for Taskbars
And lastly, we pass on to consider options for displaying task labels. By default, HTML content is displayed inside taskbars after it is specified in the task_text template. But in our demo textual content for tasks is shown outside taskbars as well.
If it is necessary to display text outside the taskbar, the task_text template should include the text_position parameter. In this case, an empty string is returned in the task_text template.
if (task.text_position) {
return ""
}
return task.text
};
Let us examine in more detail how to add a text block to the left side of the taskbar. For this purpose, we used the leftside_text template. This template also includes the text_position parameter, but here we return the task text.
if (task.text_position) {
return task.text
}
};
The position of the task text is specified using CSS styles. The first part of the selector is returned by the task_class template, while its second part (.gantt_side_content.gantt_left) can be taken from the element to the left of the taskbar.
Following these instructions, you can create a custom project roadmap with DHTMLX Gantt that is similar to our sample.
Wrapping Up
Roadmaps and Gantt charts are both visual project management tools and may seem similar, but they are used by project teams for different purposes. The use case described above shows that you can create a custom project roadmap on the basis of our JavaScript Gantt chart. Thus, our library gives you an opportunity to integrate these functionalities into a web app and use them simultaneously for moving projects forward. Try it yourself by downloading a free 30-day trial version.
If you have in mind an interesting customization scenario for DHTMLX Gantt, feel free to send it to us and we might choose it for one of our future articles of the series.