Despite summer being traditionally the holiday season, the development of JavaScript components never stops at DHTMLX. Our dev team delivered an extensive update of the JavaScript Gantt library hugely boosting its performance and presenting new features. Now our Gantt together with its resource panel is much more rapid than ever before. We also added such new possibilities as zooming by mouse wheel, creating tasks by drag-n-drop right from the timeline, and expanding split tasks. On top of all, we improved the work of inline editors, cleaned up the API and fixed some smaller issues.
Try out all the new features in a free 30-day evaluation version >
Boosting Gantt Chart Performance
The smart rendering extension underwent a major update, which boosted Gantt chart performance, in resource panels in particular. Now the extension is included in the main component by default.
In practice, it means that:
1) You should see a major performance improvement for large charts, especially if you use the resource panel.
2) We removed dhtmlxgantt_smart_rendering.js extension from the package, as it became redundant.
3) Using static_background config is no longer necessary. Now a default background is rendered with the ability to highlight individual columns and cells of the timeline.
No specific settings are now needed to address the rendering performance. Everything should work blazingly fast out of the box.
Surely, there is still room for further improvements, and we’re going to work on accelerating dhtmlxGantt in future updates.
New Module for Timeline Zooming
In v6.2 the zooming feature became much more intuitive and user-friendly both for developers and end users. We introduced a new zooming module, which provides a simple API for managing zoom levels of the Gantt chart.
Firstly, there is an ability to set up the available zoom levels and manage them using simple Zoom In and Zoom Out methods. To define the available zoom levels:
zoomModule.init({
levels: [
{
name:"day",
scale_height: 27,
min_column_width:80,
scales:[
{unit: "day", step: 1, format: "%d %M"}
]
},
{
name:"week",
scale_height: 50,
min_column_width:50,
scales:[
{unit: "week", step: 1, format: function (date) {
var dateToStr = gantt.date.date_to_str("%d %M");
var endDate = gantt.date.add(date, -6, "day");
var weekNum = gantt.date.date_to_str("%W")(date);
return "#" + weekNum + ", " + dateToStr(date) + " - " + dateToStr(endDate);
}},
{unit: "day", step: 1, format: "%j %D"}
]
},
{
name:"month",
scale_height: 50,
min_column_width:120,
scales:[
{unit: "month", format: "%F, %Y"},
{unit: "week", format: "Week #%W"}
]
},
{
name:"quarter",
height: 50,
min_column_width:90,
scales:[
{unit: "month", step: 1, format: "%M"},
{
unit: "quarter", step: 1, format: function (date) {
var dateToStr = gantt.date.date_to_str("%M");
var endDate = gantt.date.add(gantt.date.add(date, 3, "month"), -1, "day");
return dateToStr(date) + " - " + dateToStr(endDate);
}
}
]},
{
name:"year",
scale_height: 50,
min_column_width: 30,
scales:[
{unit: "year", step: 1, format: "%Y"}
]}
]
});
And to manage zoom levels:
// or
zoomModule.zoomIn();
// or
zoomModule.zoomOut();
Secondly, and most importantly, end users can switch between Gantt chart scales just with the help of the mouse wheel:
 Check the sample >
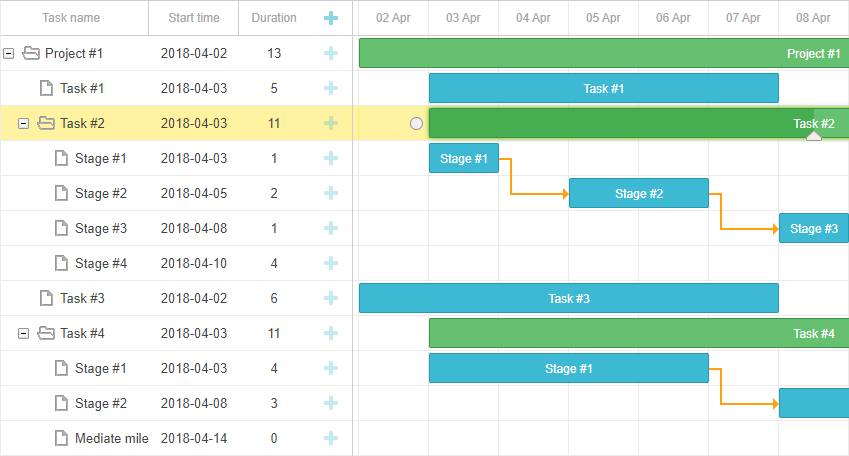
Expanding and Collapsing Split Tasks [PRO]
With v6.2 end users can expand and collapse split tasks from the interface of the grid in order to view them as separate subtasks and manage them conveniently. This feature is turned on with the help of a new configuration option open_split_tasks:
Improved Drag-n-Drop
We are always looking for ways of improving the user experience of dhtmlxGantt. As a part of this endeavor, we introduced a module with an updated drag-n-drop feature. Using this module, you can create new tasks directly in the timeline area of the Gantt chart.
Besides, the new module provides an API that you can use to bind drag-n-drop to any behavior you need like selecting multiple tasks in order to move them across the timeline, adding a note to the area in the timeline, creating split tasks, setting time of unscheduled tasks, etc.
Selecting multiple tasks and moving them:
 Check the sample >
Creating subtasks of split tasks using drag-n-drop in the timeline area:
 Check the sample >
Inline Editors Update
Another UX improvement concerns the work of inline editors. We changed their default behavior following the patterns of popular apps like MS Project. Now changing the start date triggers a task to move, changing the end date modifies the duration of a task, and changing the duration modifies the end date. Learn more in our docs >
However, you are free to stick to the old behavior of inline editors with the help of the following configuration option gantt.config.inline_editors_date_processing:
Enhanced Setup of the Timeline Scale
The update introduced an easier way to set up scales of the timeline by reducing the number of configuration options to one gantt.config.scales. Now developers can configure all the available scales using this configuration option alone:
{unit: "month", step: 1, format: "%F, %Y"},
{unit: "week", step: 1, format: weekScaleTemplate},
{unit: "day", step: 1, format: "%D", css:daysStyle }
];
Old settings will be deprecated. However, you may still keep on using them in your current projects, although we recommend switching to the updated settings in new projects.
API Update and Other Improvements
Besides the changes in the API described above, we replaced several other configs and templates with more intuitive ones. Please check the details in the migration guide >
Other minor issues were fixed in v6.2:
- Multiple tasks highlighting resets after rendering
- Script error when destroying Gantt from data processor handler
We hope that the update of dhtmlxGantt 6.2 will come in useful in your projects. You may get the latest trial version on the download page. Current clients will receive the updated package in their Client Area.
We’ll be looking forward to your feedback! Stay tuned!