JavaScript KPI Dashboard
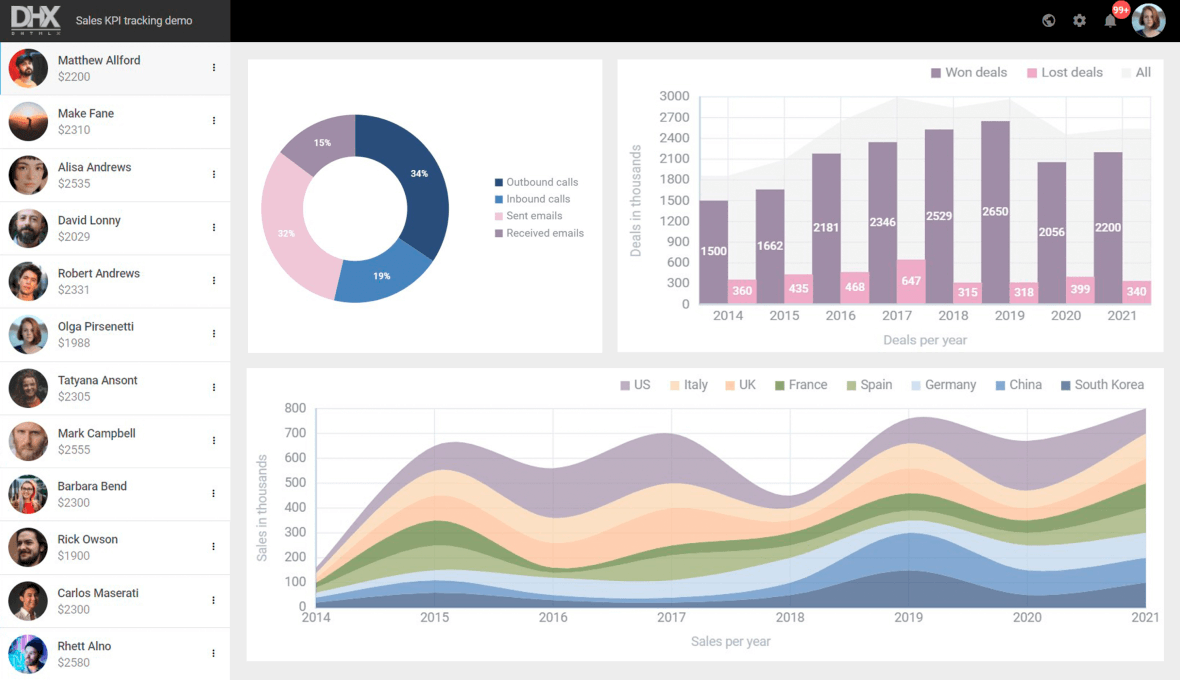
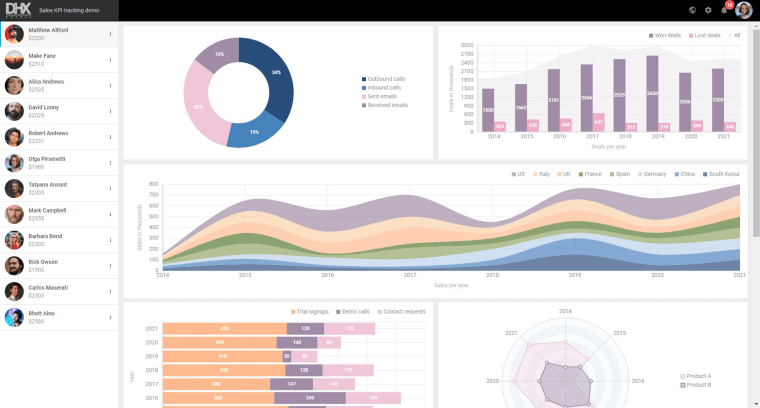
DHTMLX KPI demo is a ready-to-use example of an app built with JavaScript UI widgets for tracking sales activity and performance
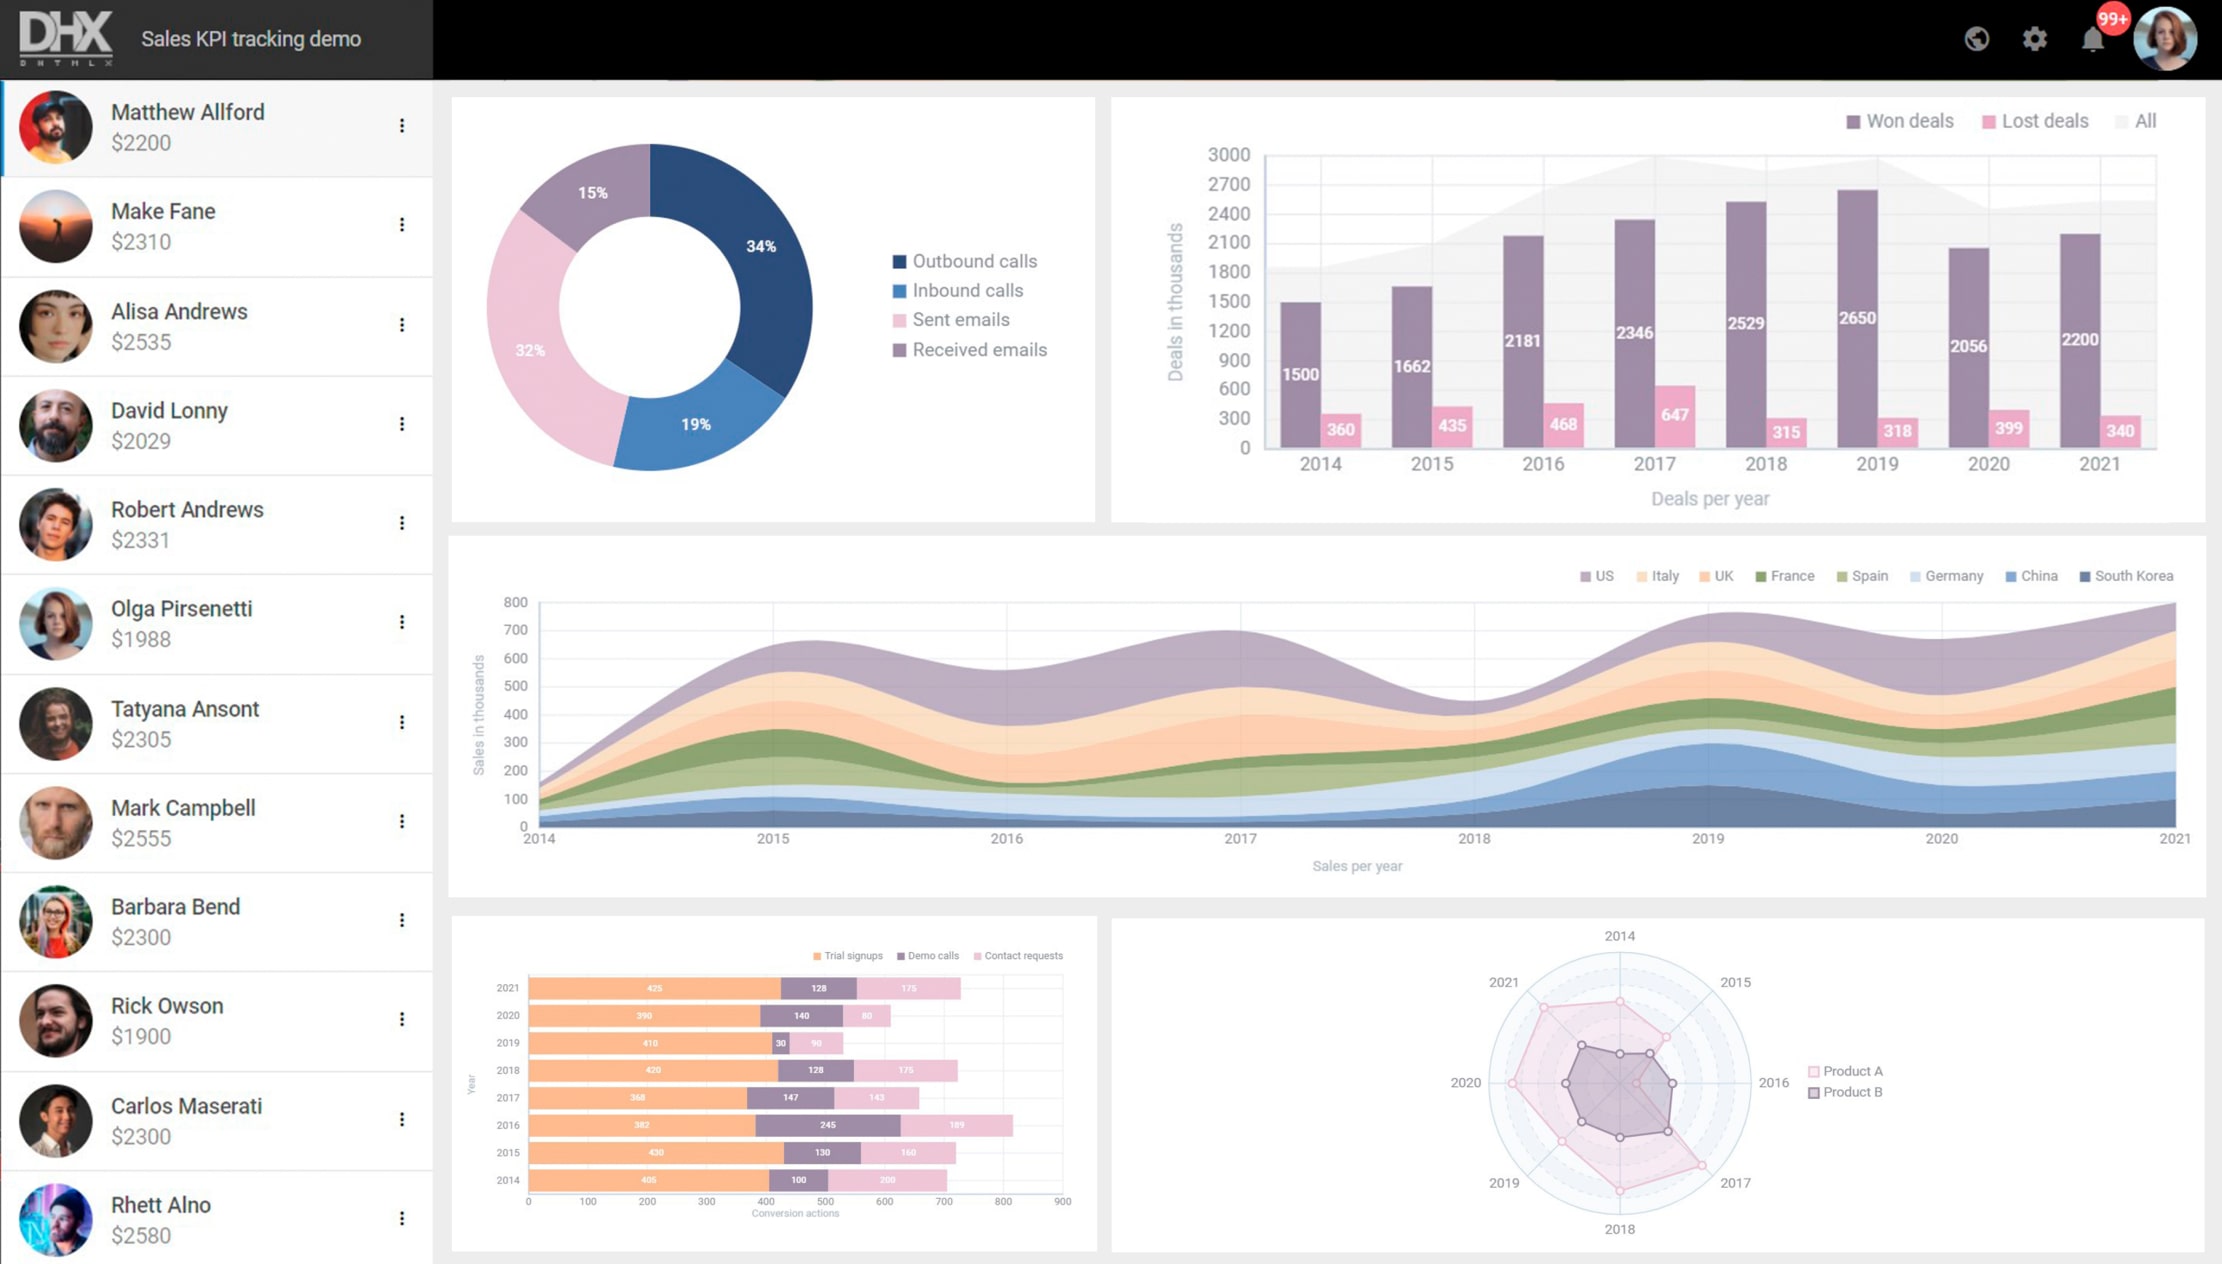
This KPI tracking demo allows users to monitor sales efficiency by an employee, number of deals, time, geography, and conversion rates. It was built with the following JavaScript widgets: Charts, List, Toolbar, and Layout.
UI Widgets for Building JavaScript KPI Tracking Demo
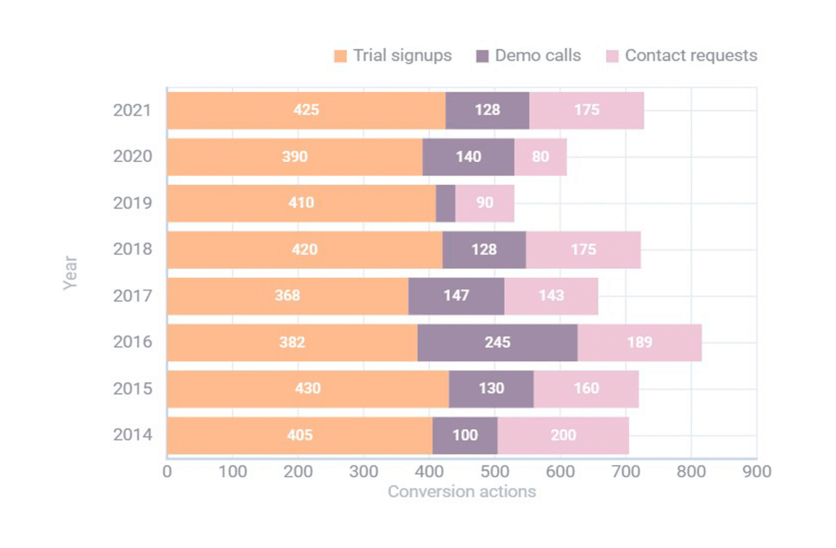
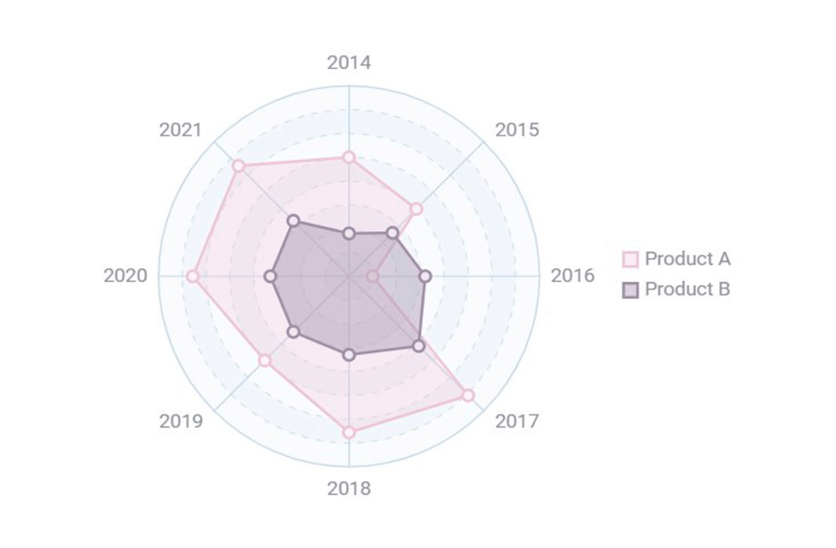
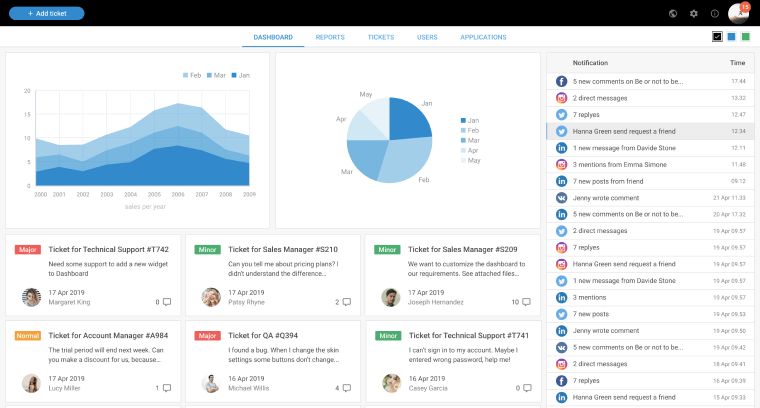
KPI Visualization
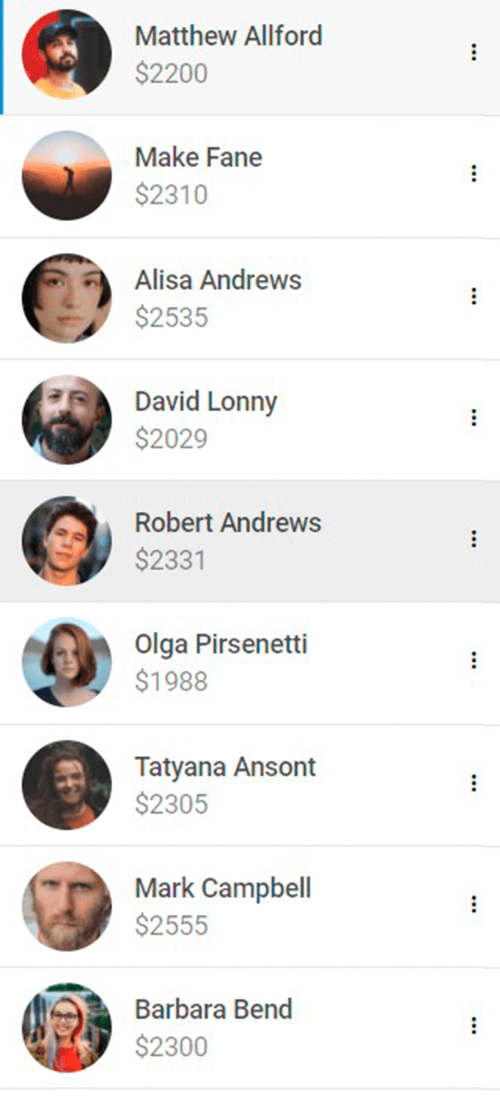
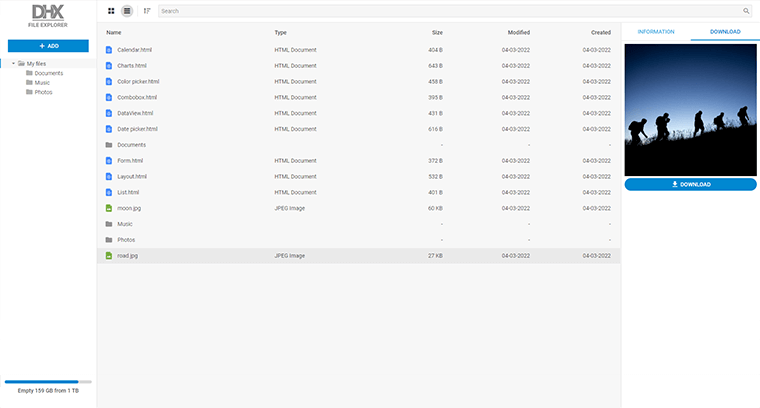
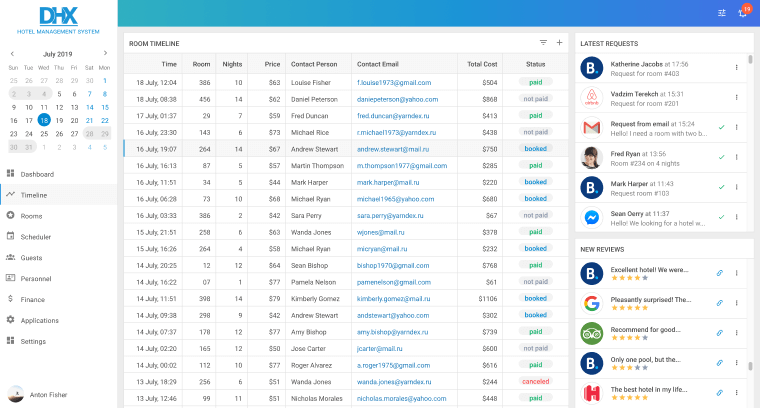
Web Interfaces

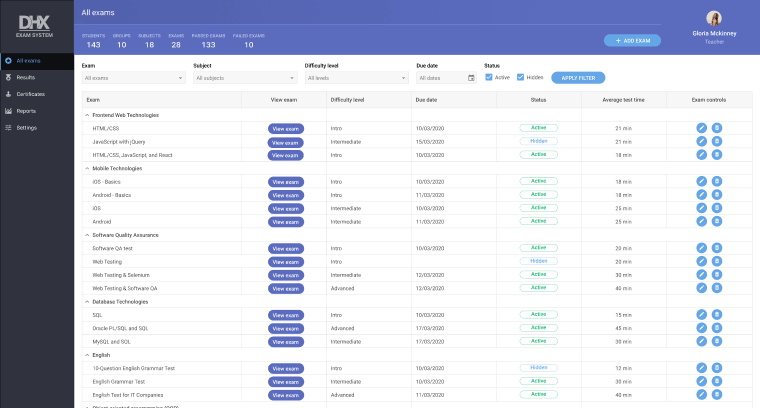
System Navigation
Features of KPI Tracking Demo App
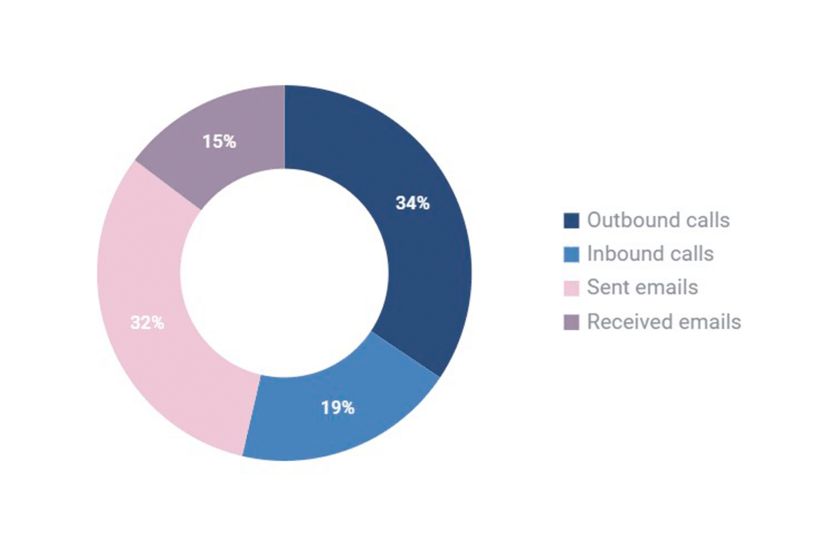
- Monitor the percentage of calls and emails per sales representative
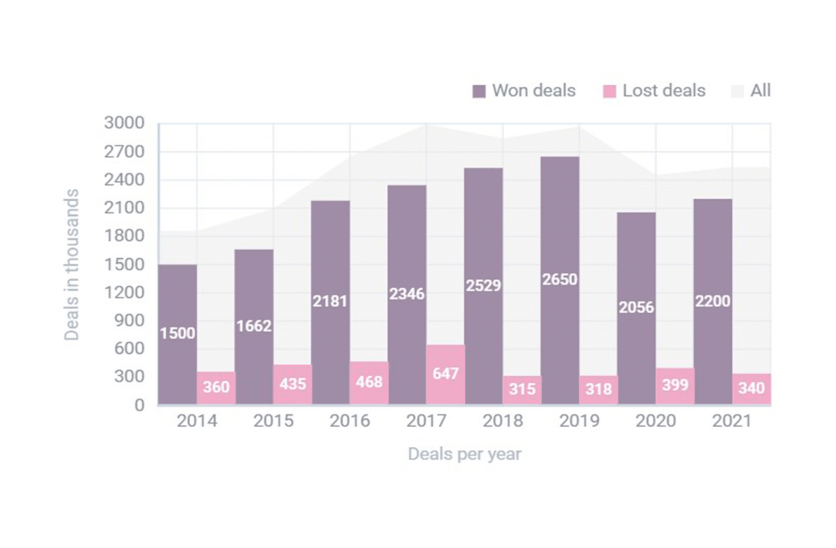
- Display win/loss ratio
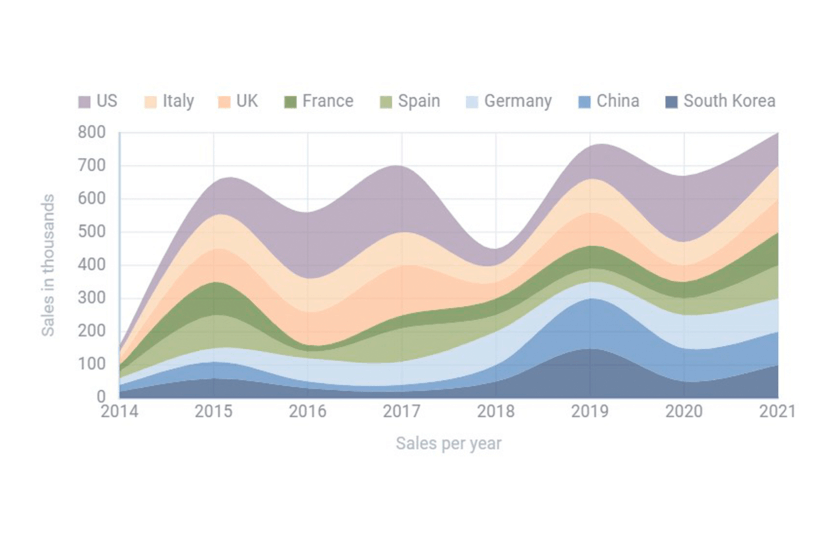
- Track sales growth by year and region
- Monitor yearly conversion rate
- Compare the number of products sold each year
- Calculate the average deal size per rep
- Remove a list item
- Switch language
- Open the Settings page
- Receive notifications
- Show profile settings
- UI and features provided by customizable Suite widgets
- Modern appearance based on Material Design
Want to save time and effort? We can develop web apps of any complexity for you. Contact us
Other Demos and Templates
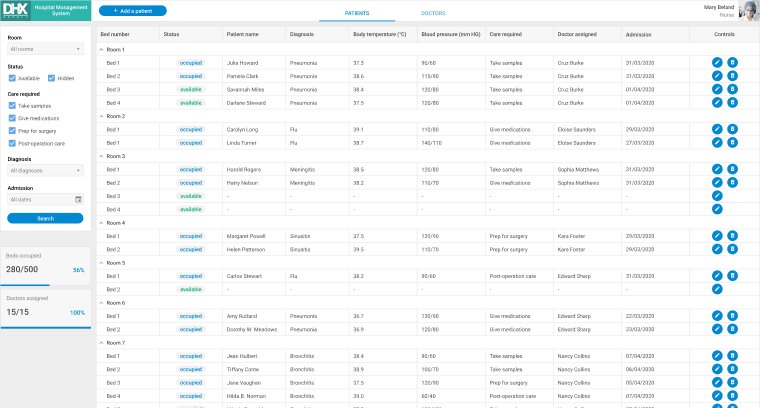
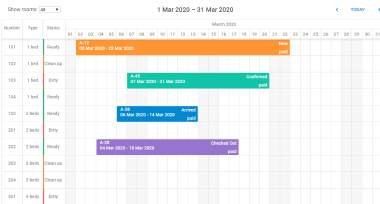
DHTMLX Suite includes 20+ components for creating fully-fledged web apps
for business, manufacturing, government,
education, healthcare, and other realms.

Try All UI Components for Free
All dashboard widgets are included in Suite library. You can download the free trial version of Suite and benefit from:
30 days of free evaluation
Official technical support
Full toolkit of 23 components
PRO features
a Question