DHTMLX Chart was one of the central figures in the latest major release of our JavaScript UI widgets library (v8.0). This charting widget received a couple of important updates but the most notable of them is a new data visualization option – a calendar heatmap chart.
In this post, we take a closer look at this chart type, its purpose, fields of application, and the benefits of using DHTMLX for its implementation.
What is a Calendar Heatmap Chart and How it Works
A calendar heatmap chart provides a visual representation of comparative data, depicting data points with color ranges in a two-dimensional calendar view encompassing various periods of time. Each cell in the chart corresponds to a single day of the week and the whole time period spans from a week to a year. The color-coded format allows displaying complex data in a compact and clear way. A heatmap chart is commonly complemented with a legend that makes it easily readable. Thus, you can detect various patterns or anomalies over the necessary period much faster.
Heatmaps were used as early as the 19th century. The first known usage of heatmaps is attributed to a French statistician Toussaint Loua, who applied this kind of technique for presenting different social statistics across the districts of Paris in 1873. The term “heatmap” was first trademarked in 1991 by an American software designer Cormac Kinney. He used this type of chart for displaying financial market information in his software solution.
Nowadays, heatmap charts have become a must-have visualization tool for data analysis in many fields:
- business analysis
- websites (user interaction analysis)
- geography
- biology
- sports
- and more
Now let us discuss how to add a calendar heatmap chart to a web page and customize it with DHTMLX Charts.
Benefits of Building a JavaScript Heatmap Chart with DHTMLX
You may be wondering why to choose DHTMLX Chart for building a JavaScript heatmap chart since there are plenty of other JS libraries that can help to do the job right. So let us go through the main stages of implementing a calendar heatmap chart like the one below and see the main benefits of using our charting library for this purpose.
 Check the sample >
Quick Initialization
DHTMLX Chart was originally designed as a developer-friendly tool, allowing you to visualize data with any of the available chart types without spending much time on it. Adding a JavaScript heatmap chart to your app takes just a few simple steps: download the Chart package and unpack it into your project folder, create a container for your chart, initialize the heatmap chart, and load data into the chart, and there you have it.
To be more specific about the initialization process, it is done with the dhx.Chart object constructor.
chart.data.parse(heatMapData);
The constructor takes two parameters, namely the container where your chart will be placed and an object with configuration properties that we will discuss in the following section.
The full information related to the chart initialization is provided in the documentation.
Simple Configuration
Now you can proceed with configuring the settings of your chart and this stage is quite straightforward. The configuration object of a calendar heatmap chart built with DHTMLX comprises three properties:
- type: “calendarHeatMap” (required) – specifies the chart type
- series (required) – specifies how data is rendered in the chart
- legend (optional) – configures a legend that clarifies the charted data
Here is how you can configure your calendar heatmap chart presented below:
type: "calendarHeatMap",
css: "dhx_widget--bordered",
series: [
{
value: "value",
date: "date",
dateFormat: "%d %M %Y",
startDate: "20 Jan 2022",
endDate: "20 Aug 2023",
tooltipTemplate: point => `The profit: ${point[1]}$, ${point[0]}`,
weekStart: "monday",
maxValue: 90,
minValue: -40,
}
],
legend: {
values: {
text: "The profit of my business per day",
tick: 5,
majorTick: 2,
step: 1,
tickTemplate: value => `${value}$`,
},
halign: "center",
valign: "top",
margin: 0,
size: 60, //
}
};
Just like other types of charts included in our charting widget, the calendar heatmap chart is highly customizable. You can easily change the styling of your chart or modify its key elements. In the code of our example, you may notice the use of the tooltipTemplate parameter intended for specifying a template for displaying values of data items in tooltips. Other common customization options for charts are described in the corresponding section of our documentation.
One of the key strengths of our calendar heatmap chart is that it allows visualizing data for various periods of times. By default, end-users will see the information dating from the 1st of January of the earliest year to the 31st of December of the latest year provided in the dataset. But at the same time, our chart gives you plenty of customization opportunities related to date ranges.
Custom Date Ranges in Heatmap Chart
It is often the case that end-users may need to see data within a particular timeframe rather than the whole dataset that may be too large. For this purpose, the configuration object of our heatmap chart includes startDate and endDate parameters in the series property. It should be noted that the date format for these parameters depends on the dateFormat property.
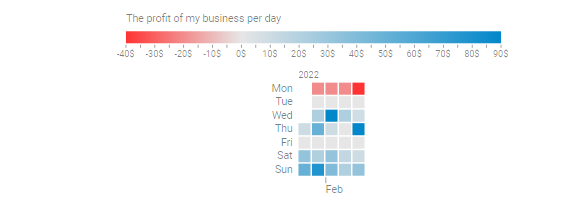
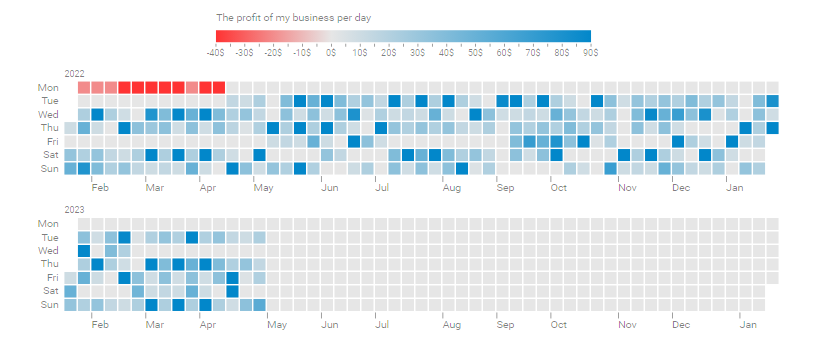
In our example presented above, the date range spans from “20/01/22” to “20/08/23” inclusively i.e. the whole period includes one year and eight months. By changing startDate and endDate parameters, we can also set our chart to display data for a month, a year, or any other period. Here is how we make the chart in our sample show data for one month:
type: "calendarHeatMap",
series: [
{
value: "value",
date: "date",
dateFormat: "%d %M %Y",
startDate: "20 Jan 2022",
endDate: "20 Feb 2022",
}
],
}
Moreover, if you do not specify one of the date parameters, the chart will calculate the range of dates automatically depending on the other parameter and the dataset. In our example, if we set a value for the startDate parameter but left the endDate parameter empty, the chart would include the period from “20/01/22” to “19/01/24”.
All the details on custom date ranges in a calendar heatmap chart are available in the documentation.
Integration with Other DHTMLX Components
Since heatmap charts are quite useful for business purposes, we offer you integration samples with top DHTMLX products for project management – Gantt, Event Calendar, and Scheduler.
 Check the sample >
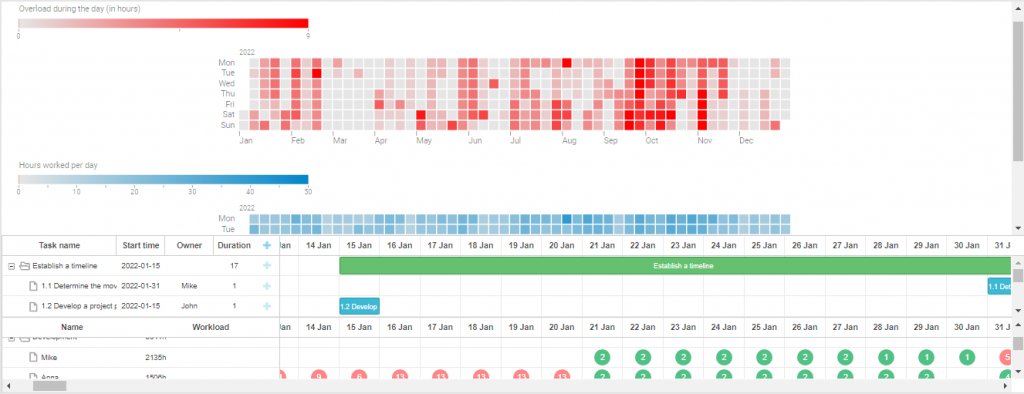
The image above shows how a calendar heatmap chart can be useful in providing a general overview of working hours and overloads presented in the histogram of the JavaScript Gantt chart. Thus, you can get an additional source of information in your project management app.
Wrapping Up
Summarizing the above, we can say that DHTMLX Chart is a reliable instrument for adding a calendar heatmap chart to a web page. A wide range of configuration and customization options will help you to adjust the chart to your requirements and ensure a good user experience.
You can get acquainted with our calendar heatmap chart using the DHTMLX code snippet tool or download a free 30-day trial version and see if it fits for your project. Bear in mind that this chart type is available only in the PRO edition of DHTMLX Chart and DHTMLX Suite. If you decide to go with DHTMLX Chart, it can be purchased as a separate JavaScript component or in a pack with other Suite widgets.