Updated on March 25, 2026
Today, we have access to an infinite amount of information in just a few clicks. It opens great opportunities for doing business, but at the same time poses the challenge of effective data usage. That’s where data analysis comes in handy. It is the process of collecting, cleaning, transforming, and visualizing data in a well-structured form. The key objective of data analysis is to discover valuable insights for data-driven decision-making.
Many companies invest in the development of web applications that facilitate this process. If this is true in your case, this blog post can be really useful. DHTMLX offers JavaScript Data Grid, Chart, Spreadsheet, and Pivot libraries designed for implementing the core functionalities required for effective data analysis.
Let us have a closer look at each JavaScript data analysis library from DHTMLX and discover the benefits of integrating them into modern, AI-assisted workflows.
DHTMLX Grid for Tabular Analysis
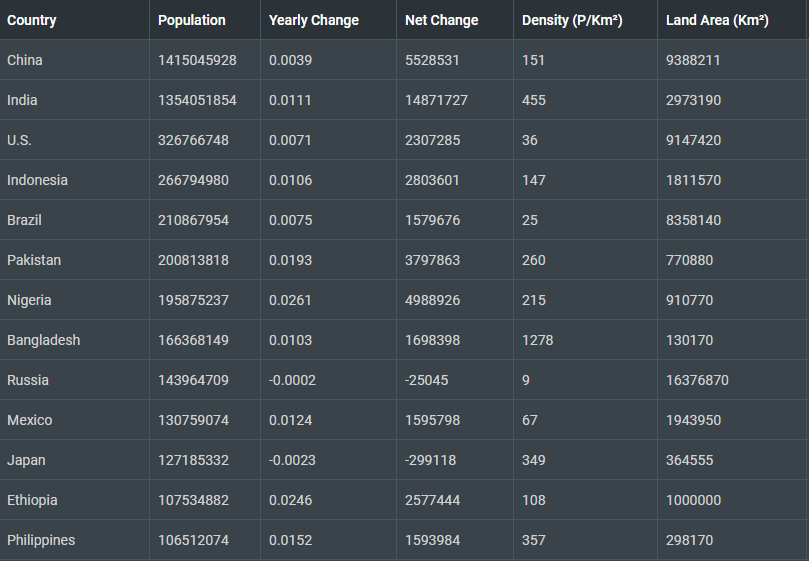
When working on a web project aimed at data analysis, it is hard to go without an enterprise JavaScript datagrid like DHTMLX Grid . This UI element, also referred to as a data table or simply grid, is widely used to arrange information in a tabular format. DHTMLX Grid allows not only presenting large amounts of data in rows and columns but also provides many useful features that make the interaction with data more convenient and effective.
 Check the grid sample with a drag panel >
For instance, you can enable end-users to perform a range of useful operations:
- reorder any row and column with drag-and-drop,
- select and move several rows at once,
- freeze columns and rows,
- filter and sort data,
- simultaneously select multiple cells,
- resize columns,
- add multiline cell content,
- and much more.
All interactions can be configured via the Grid API, delivering powerful interactive features.
To make data analysis even more effective and insightful, DHTMLX Grid offers multiple ways to arrange and explore data tables with intricate structures. In addition to the built-in TreeGrid mode for presenting hierarchical data, it is possible to apply row grouping based on specific criteria in combination with multisorting. Thus, it becomes easier to interpret data and reveal patterns at different levels of granularity.
 Check the sample with grouping and multisorting >
The analytical capabilities for end-users can be further extended with data summaries and on-demand retail views. DHTMLX Grid allows displaying summaries of custom calculations for a certain column or the whole JS grid table, which are often requested in different types of reports. The row expander feature gives a great opportunity to show nested content on demand in Grid sub-rows. This approach helps access to deeper insights by enriching sub-rows with any Suite widget (e.g. Grid, Form, Chart, etc.) or HTML content without cluttering the UI.
 Check the sample with a sub-row containing extra grid >
DHTMLX Grid is also notable for the possibility to set up a range of spreadsheet-like interactions via API modules with advanced settings. For instance, the JavaScript data table built with DHTMLX can include history management with undo/redo options, intuitive range selection, clipboard operations, and enhanced data selection mechanics.
 Check the grid sample with history management >
If changes have to be made in tabular data, our Grid component comes with a range of built-in column editors for specifying the way of editing grid cells depending on their content. Moreover, it is also possible to add your own set of different editor options in cells of the grid’s columns. Input masks for various data formats help ensure accuracy and data consistency during editing. Displaying the content of various lengths becomes easier thanks to the availability of the auto height mode that dynamically adjusts the table’s overall height to fit its content. It also won’t be a problem to display any numeric value in the desired way, since our JavaScript Grid library supports various number formats.
 Check the grid sample with multiple editors>
The Grid API offers multiple customization options to change the grid styling and to complement the table with your own HTML content, tooltips, cell marks, and header/footer filters.
Check the grid sample with styling via custom CSS>
Another great thing is that you can safely choose our JavaScript datagrid for large datasets. You can easily upload JSON files with tables with 100,000+ rows and they will be rendered in milliseconds without performance limitations. Our Grid uses the lazy loading technique to speed up the performance of your app by loading only the part of the web content that is expected to be seen at a given time. Apart from that, you can also integrate the pagination widget into the grid table to split big data into multiple pages for better navigation.
When grid data needs to be taken beyond the grid UI, the component provides rich exporting settings into the CSV, XLSX, PDF, and PNG formats. You can configure how data will be exported by filtering out unnecessary rows and columns, modifying content, defining format-specific settings, and adjusting the visual styling. This level of control allows you to tailor grid data to further usage scenarios.
Finally, it is necessary to point out that our JavaScript Grid for data analysis can be empowered with AI like in the “Customer Review Analysis with AI” demo.
Useful resources: guides, live samples, free trial version.
DHTMLX Chart for Data Visualization
Arranging large amounts of data in a tabular format helps to keep things in order, but you may still miss important patterns, trends, or inconsistencies. This is where data visualization becomes a great addition. Tools like DHTMLX Chart help you visually present datasets of any complexity using popular chart types such as bar, pie, spline, area, donut, scatter, radar, treemap, etc. Moreover, this JavaScript chart library allows combining several charts into one (e.g., line + spline+ area charts) to compare different data aspects within a single view.
 Check the treemap chart javascript sample
Using the flexible API of our JavaScript data visualization library, it is easy to configure the main chart properties (scales, series, legend) exactly the way you like. You will certainly appreciate the possibility to enrich charts with various useful features such as grid lines, baseline, logarithmic scale, tooltip, label, and many others. Since DHTMLX Chart also supports live updates, it is well-suited for scenarios where data changes frequently, such as dashboards or monitoring tools.
 Check the chart sample with synced grid>
Just like the Grid component, our HTML5 Chart library is offered either as part of the Suite library, which includes other UI widgets, or as a standalone tool. When using any of the Suite widgets described above, you can quickly change their overall appearance with built-in themes and introduce targeted changes via CSS classes or templates.
Both DHTMLX Grid and Chart support export to PDF and PNG formats and comply with popular accessibility standards, including WCAG 2.0. Our team also created multiple demo applications that vividly demonstrate practical use cases for these JavaScript tools for data analysis, combined with other Suite widgets. In this GitHub repository, you can learn how to implement a multiuser backend for any data-centric Suite widget for real-time data synchronization.
When it comes to data visualization, DHTMLX Charts can offer you:
- 13 popular chart types for visualizing and analyzing data,
- flexible configuration of charts’ visual elements and behavior,
- real-time updates for dynamic data visualization,
- smooth data synchronization with other Suite widgets.
Useful resources: guides, live samples, free trial version.
DHTMLX Spreadsheet for Excel-Like Workflows
For displaying and manipulating data at a higher level, DHTMLX offers the JavaScript spreadsheet component. It allows you to compactly place an Excel-like table on a web page and populate it with data that can be edited on the fly.
DHTMLX Spreadsheet comes with a collection of predefined formulas for performing different kinds of operations, formatting string data, and checking conditions with boolean operators. All of them are usable in Excel and Google Sheets. You can also create multiple sheets for dividing data into various categories and, if necessary, consolidate specific pieces of information from multiple sheets via cross-referencing using needed formulas.
 Check the spreadsheet sample with calculations and cross-referencing >
Formulas come with pop-up descriptions that appear as users start typing, helping reduce errors in complex calculations. All formulas are fully compatible with Excel and Google Sheets.
This Excel-like JavaScript Spreadsheet has a user-friendly interface with numerous built-in capabilities such as:
- undo/redo actions,
- data searching,
- freezing columns and rows,
- locking and unlocking cells,
- adding and deleting columns and rows,
- hiding and showing columns and rows
- sorting and filtering operations
- changing row height,
- and more.
 Check the spreadsheet sample with rows&columns manipulations >
It also provides a considerable list of hotkeys serving to simplify the spreadsheet navigation. To automate the process of entering repetitive data in table cells, our JavaScript Spreadsheet for web apps includes the select editor with a drop-down list of options and cell validation.
 Check the spreadsheet sample with cell editors and validation>
End-users can enter text of any size in cells and fully see it thanks to the text wrapping option, embed links in the content, merge cells, and split them back. It also provides a considerable list of hotkeys serving to simplify spreadsheet navigation. Multiple border styling options allow emphasizing crucial pieces of data in large datasets.
There are seven customizable default data types (common, date, text, number, currency, percent, time) for showing numeric values in cells. If that’s not enough, you can also add custom formats. The library also offers convenient localization for numbers, dates, times, and currencies, making these parameters adaptable to the formats used in specific regions.
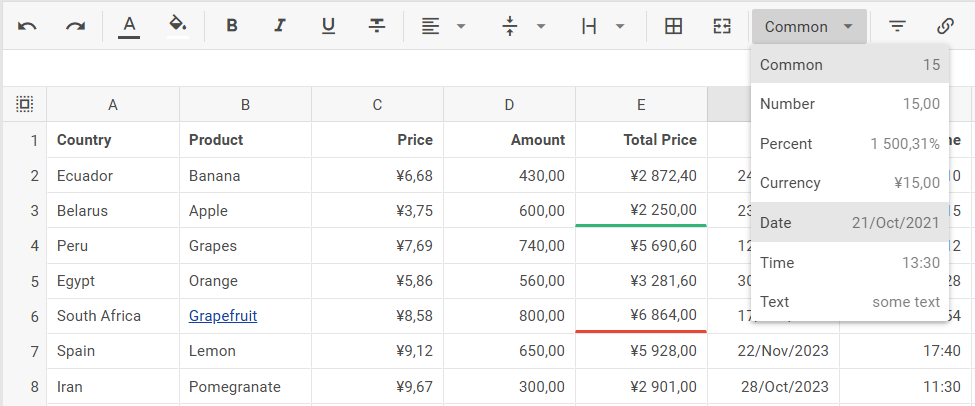
Check the spreadsheet sample with localization for data formats >
Moreover, it is possible to modify the look and feel of the spreadsheet or its elements to adjust it to project requirements.
In general, our JavaScript Spreadsheet component provides the following benefits:
- intuitive Excel-like interface,
- constantly growing collection of built-in formulas and functions,
- numerous options for efficient working with data in cells.
Useful resources: guides, live samples, free trial version.
DHTMLX Pivot for Summarizing and Reporting Large Datasets
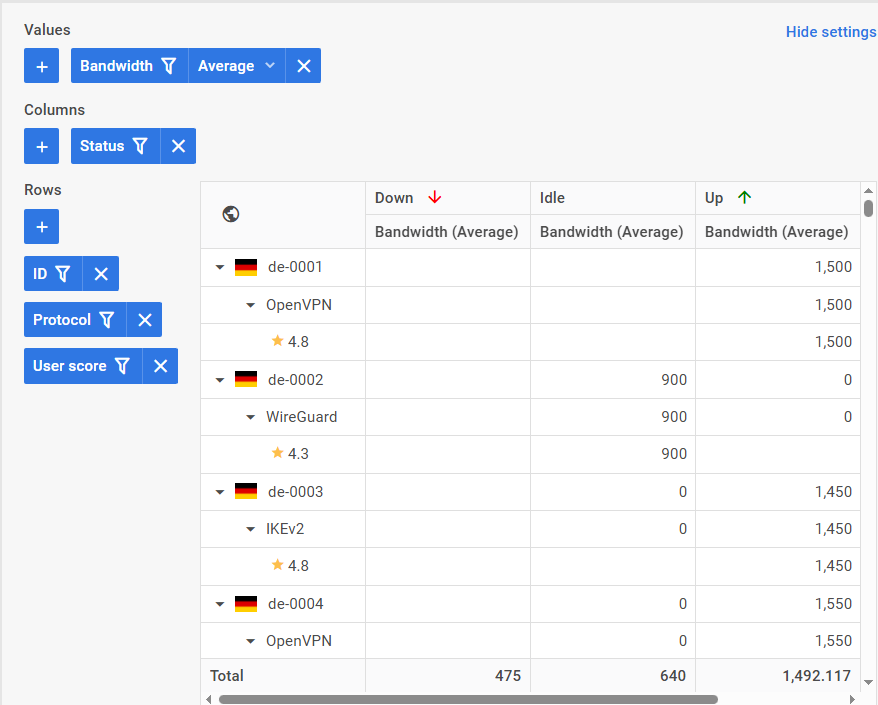
In case you require a tool that, along with storing and representing data, includes summation and reporting functions, DHTMLX Pivot is a suitable option for consideration. Unlike grids and spreadsheets, our JS Pivot library enables you to quickly create informative data summaries with the help of a chosen aggregation function and numerous filtering/sorting parameters.
By default, our JavaScript Pivot table provides not only common types of data operations (min, max, sum, count) but also more complex options such as median, average, product, etc. In addition, you can add custom math methods to give end-users more options for analyzing data and drawing valuable insights. The library supports locale-dependent formatting for number and date fields.
 Check the pivot sample with custom math methods >
Data filtering is one more important asset of this JavaScript reporting component. It enables you to specify filters depending on the data type (string, number, date) right from the UI or via the API. You can make use of a global filter for applying several filtering rules to the dataset or remove all existing filters at once.
 Check the pivot sample with custom marks for cells >
After the complete codebase overhaul (in v2.0), the Pivot component is much more effective at handling big datasets. Also, it provides a range of useful configuration options for columns, including the ability to freeze columns on both sides of the pivot table, collapse and expand columns, arrange headers vertically, and add an extra column with total values. Also, there is a tree mode for presenting hierarchical data.
 Check the pivot sample with with frozen columns >
When it is necessary to increase the visibility of specific cells and headers, our JavaScript Pivot grid also has something to offer. For instance, it is possible to apply custom styles to individual cells based on the field name, cell value, and other parameters. Additionally, pivot cells can be enriched with diverse HTML content via templates.
 Check the pivot sample with HTML content in cells >
With DHTMLX Pivot in your technology stack, you can get:
- powerful instrument for generating data summaries and quick reports,
- adjustable pivot structure for effective data analysis,
- simplified pattern recognition and decision making.
Useful resources: guides, live samples, free trial version.
All JavaScript libraries for data analysis reviewed in this article also share a range of highly demanded features:
- high performance with large datasets,
- full interface customization,
- integration with top JavaScript frameworks (React, Angular, Vue),
- cross-browser and multi-platform compatibility,
- TypeScript support,
- data export to Excel and CSV formats,
- complete UI localization.
Using our feature-packed JS data analysis libraries, you can build web apps that will cover your needs in data analysis.
If the development workflow involves the use of AI assistants, it is highly recommended to use the DHTMLX MCP server. It ensures that AI tools can access up-to-date and relevant documentation of all DHTMLX products, including the components described in this post, thereby improving the accuracy and usefulness of generated responses.
Conclusion
As you can see, DHTMLX provides a solid pack of JavaScript UI tools for building web apps with a strong focus on data analysis. High configurability, ample customization options, and compatibility with top web technologies make DHTMLX products a natural fit for modern technology stacks. Detailed documentation and numerous live samples will help you to quickly get started with our components and make the most of them in your project.
As a bonus, there is a useful video tutorial that explains how to work with code snippets for our JavaScript libraries more efficiently.
If you are still unsure whether DHTMLX is the right choice for your web project, download a free 30-day trial version of any product to make a personal assessment of its suitability.