Our new customer spotlight features the project portfolio management software developed by the French project player IQAR. Our guests are Madalina and Benjamin, who will share their experience of working with DHTMLX Gantt, which is the centerpiece of their solution SuitePro-G.
Could you tell us a bit about your project and your role in it?
Benjamin: I am a web developer at IQar. I am a full-stack developer working on C# technology on the backend and JavaScript/jQuery as frontend. I’m at IQar since August 2020. I have worked on the DHTMLX Gantt component several times.
Madalina: I am Madalina. I joined the company at the beginning of this year, in January. I am also a part of the web development team and I’m recently in charge of international marketing as well.
IQar is a Project Portfolio Management expert with more than 10 years of experience. We have clients and partners in France and internationally that come from different sectors of activity. IQar guides small, middle, and big companies wishing to develop a real project culture. More than 100 French and international organizations trust IQar and more specifically its cloud solution SuitePro-G to manage their projects, resources, and/or portfolios. Today we have around 7000 users. Every year we have four version updates of our PPM software solution.
SuitePro-G is a pragmatic, methodological, secure, and connected software. Our software is among the cheapest on the French-speaking PPM software market. This is one of the main advantages. But also, it is much more than a simple editor. It helps to manage projects and continuously improve the skills of teams. It is a highly customizable software, currently available in French and English. However, organizations can change all the keywords to fit their common language used inside the company.
What would you like to accomplish with the help of a JavaScript Gantt?
Madalina: The Gantt chart, commonly used in project management, is one of the most widely used and effective tools to visually represent the forecasts and progress of various actions (tasks) that make up a project. Our software provides different visual management tools to help decision-making: decision slabs, score cloud (scoring method), Multi-Project Gantt chart, PMO cycle, etc. This helps our clients see more clearly and make the right decisions about which projects to start first or which ones are too risky.
The Gantt chart is an essential planning tool for project management and it’s also the most used tool in SuitePro-G. We make sure that our clients can access all the information they need just by using this visual tool. We added filters that help see things in more detail. Our objective is to regroup all the key information of a project inside the Gantt chart, to make it the central point inside our software. The roadmap has a great added value for CEOs because it groups lots of programs, shows the progress of every project, and simply gives better visibility of what is going on in the company.
Why did you choose DHTMLX Gantt among other libraries on the market?
Benjamin: We have decided to use the Gantt chart created by your company for multiple reasons. The first point is that DHTMLX has many integrated features, key features needed in a Gantt tool, such as drag and drop, links, critical path, etc.
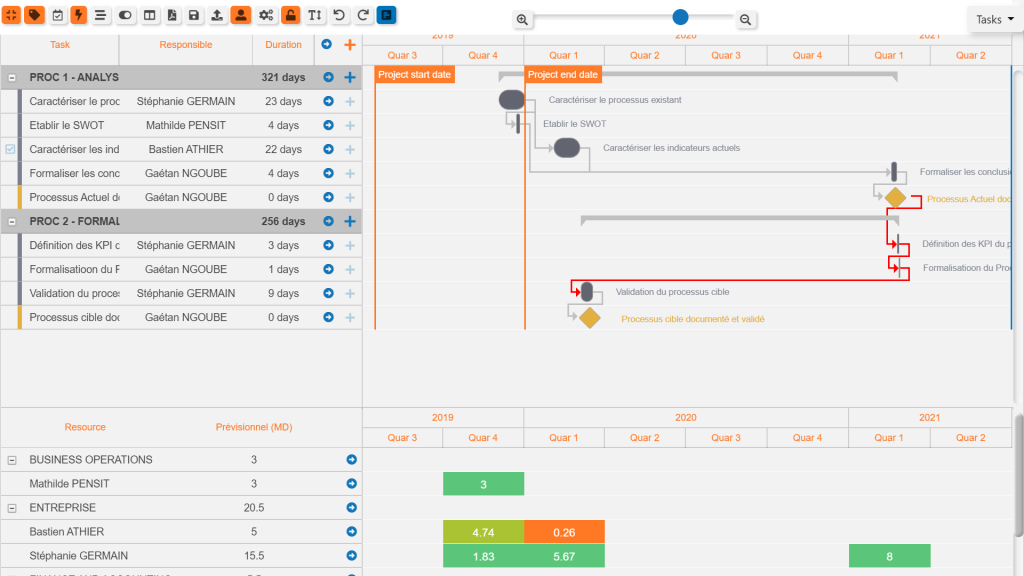 Gantt project tasks with workload and critical path in SuitePro-G
The second point is that the API is really rich. There are many methods and events which allow us to make it a very customizable tool. For example, the possibility to click on an item to redirect the customer where the needed information is available if it’s not present inside the Gantt. It is essential for us because we have clients from many different fields and with different demands. It offers the possibility to add unlimited filters and does many other things.
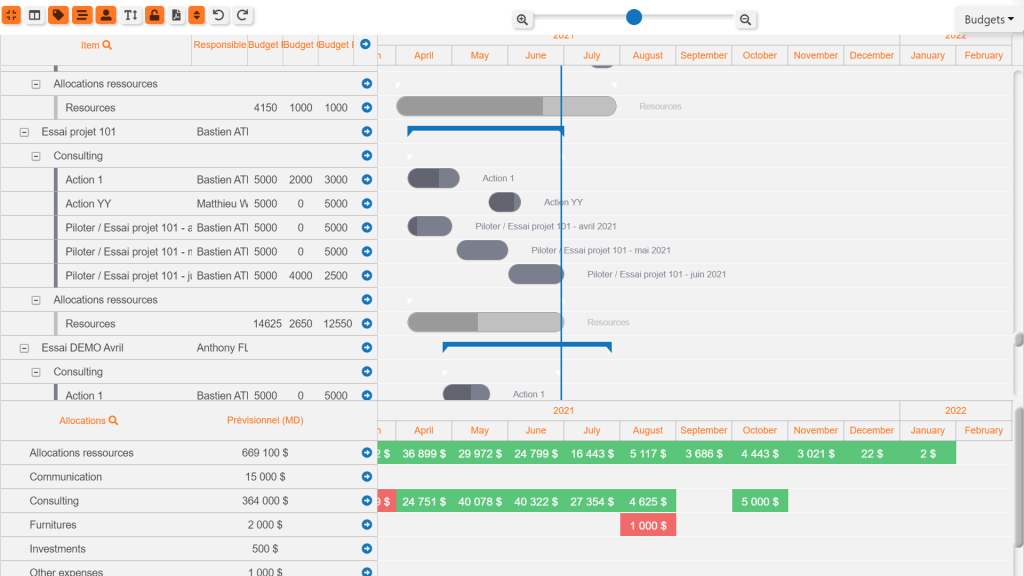 Budget roadmap with budget load
The third point is that it is a really well-documented component and this is very important for us. Also, your customer service is always there when needed.
Last but not least, it is affordable.
What are the main Gantt features that help you in your project?
Benjamin: The most used feature would be drag and drop. It helps save clients time. The possibility to link tasks between each other and be able to quickly visualize tasks’ dependencies between each other.
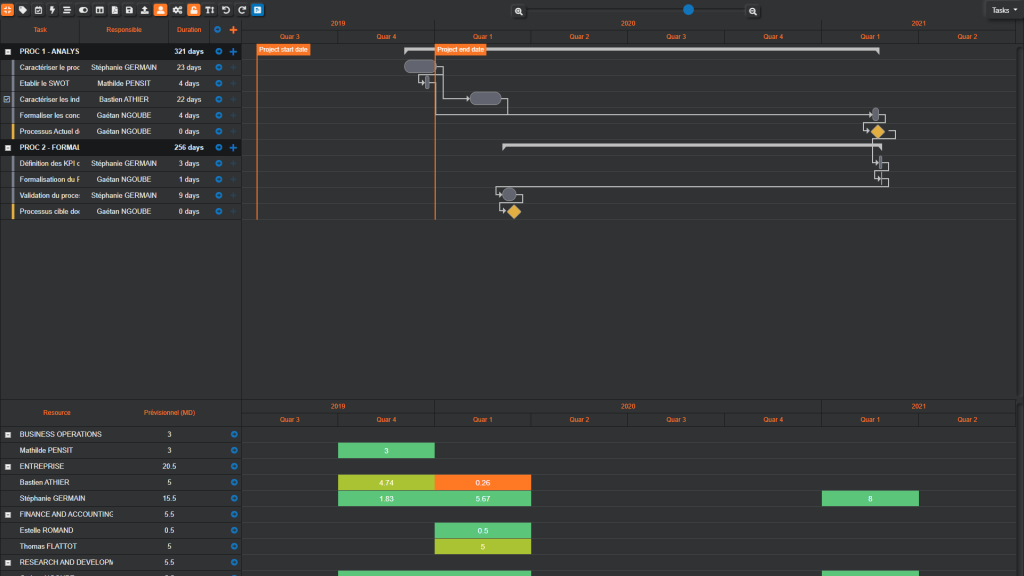 Gantt chart in the dark mode
The locker tool is useful when you need to move dependable tasks altogether while keeping the same time gap between them.
The critical path gives the possibility to quickly visualize tasks inside a project that can’t tolerate any delay. This helps drive the project manager’s attention to tasks or projects that may present a risk.
The allocation table can be displayed, with the names of the allocated resources, the amount of time spent on each task, the occupation rate. There is a color code that helps the manager to know if the resource has the available time or not.
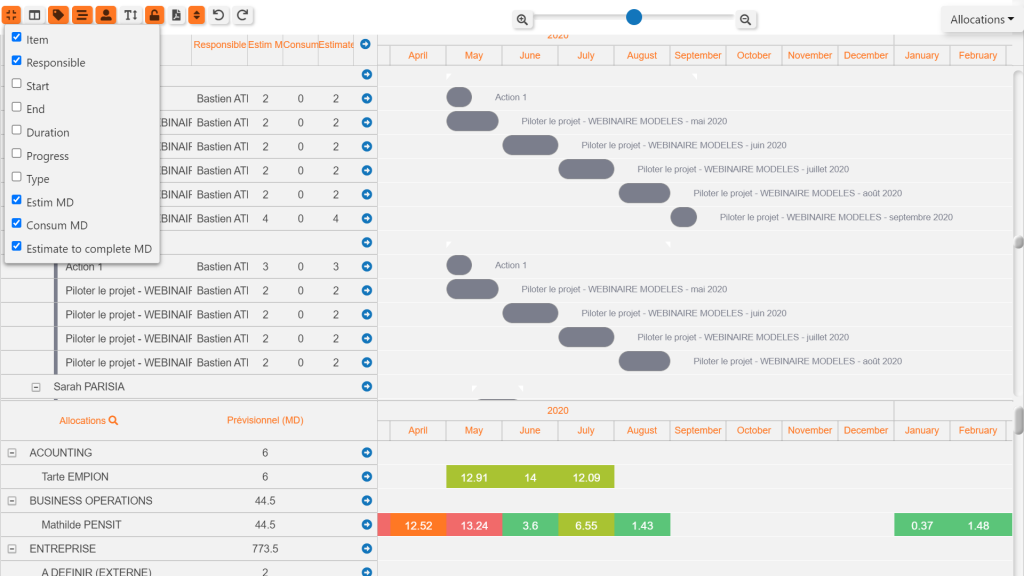 Allocation roadmap with workload column choices
Have you faced any challenges working with DHTMLX Gantt?
Benjamin: It is related to the fact that it is a highly customizable tool. With various customer requests, we made a lot of development ourselves. So, the component is far from the original. When I face difficulties, even though Gantt is well-documented, I can’t find the thing I am looking for.
Madalina: I don’t think that it’s something you can improve, because you can’t foresee the needs of our clients. Maybe offering more examples in the documentation could be a good start.
What would you recommend improving in DHTMLX Gantt?
Benjamin: As we mentioned in the previous question, the documentation could probably be improved. The examples that are given are for the original component. Since the tool changed a lot from the original in our case, it would be useful if we could find more examples in the documentation.
The navigation inside the documentation (API) could also probably be improved. Maybe the main area of improvement is the way one has to search for the information. Time is rapidly lost looking for what’s needed. The interface could be more user-friendly, this could help save some time on our search. Maybe it could be organized by the main theme or groups (like the one in Datatables, for example).
Also, the Gantt chart is a bit slow at execution, especially the road map features. We have mostly received complaints regarding this matter from several clients that have lots of projects, portfolios with a few hundreds of projects.
Which frontend and backend technologies do you use together with DHTMLX Gantt?
Benjamin: As a backend technology, we are using C# so that we can gather information from the database. And on the frontend, it’s JavaScript and jQuery to display the gathered information on the client’s side and API Ajax for the link between backend and frontend.
Thank you very much for sharing your experience with us. It is vital to know your feedback and grasp new ideas to continuously improve DHTMLX Gantt. We wish you good luck and many new customers for your project planning solution!
You can also connect IQAR via the company’s social networks LinkedIn or X.
The customer spotlight section is devoted to the stories of DHTMLX clients who successfully implemented DHTMLX libraries such as a JavaScript Gantt chart in their projects. You can explore various stories from all over the globe.