Updated on May 26, 2026
A Gantt chart still remains one of the most highly requested tools in project management apps. And our JavaScript Gantt Chart component offers everything that development teams need to make the most of this useful functionality in their projects.
In this post, you will learn how to add a basic JavaScript Gantt chart to a web page with plain JS/HTML/CSS and configure some common features for managing projects. Moreover, you’ll also become familiar with official DHTMLX wrappers for React, Angular, and Vue that simplify the implementation of Gantt charts via framework-specific declarative patterns. In addition, we’ll touch on the subject of DHTMLX readiness for the rise of AI web development.
Downloading and Installing DHTMLX Gantt
Prerequisite: first of all, it is necessary to create a simple HTML page, where your Gantt project will be placed.
In this JavaScript Gantt chart tutorial, we’ll explain how to add the Gantt component to a web page via a script tag, so you won’t require any build tools or configuration to run your sample. Note that Gantt can also be imported as an ES6 module, and we’ll talk about it a bit later.
The easiest way to start working with our Gantt is to enable a free open-source MIT licensed version from our server:
<script src="https://cdn.dhtmlx.com/gantt/edge/dhtmlxgantt.js"></script>
You can also download DHTMLX Gantt and use it locally. Here you have two possible options:
After downloading the preferred Gantt version, you should install Gantt by unpacking the downloaded package into a folder of your project, and adding links to JS and CSS files in your HTML document:
<script src="codebase/dhtmlxgantt.js"></script>
<link href="codebase/dhtmlxgantt.css" rel="stylesheet">
</head>
Initializing JS Gantt Chart & Adding Data
Before taking this important step, you have to create the div container on the page. This container is required for initializing Gantt.
<div id="gantt_here" style='width:100vw; height:100vh;'></div>
</body>
Now you should use the init method to initialize Gantt in the div container. This method takes the ID of the container as a parameter.
window.addEventListener("DOMContentLoaded", function () {
gantt.init("gantt_here");
});
</script>
At this point, you can already start using your JavaScript Gantt chart, but let us add some project data for greater clarity.
Adding Gantt Data
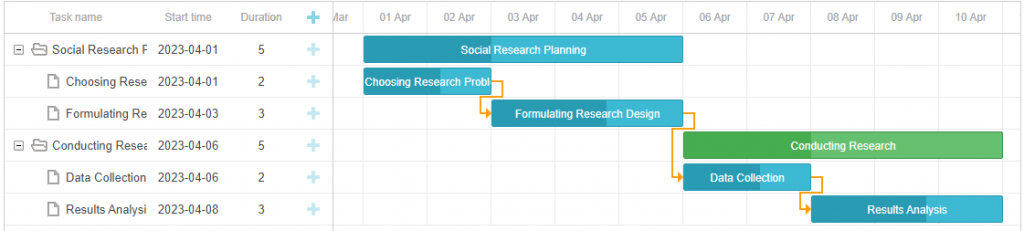
After the initialization completion, you can add Gantt data right in the HTML document or with the JS file. This data will be used as a basis for building your Gantt chart. In our example, we add two projects and two embedded tasks for each of them:
- Planning social research: 1) Choosing research problems 2) Formulating research design
- Conducting social research: 1) Data collection 2) Results analysis
Here you can also specify start/end dates, execution order, and progress for projects and related tasks.
"data": [
{ "id": "10", "text": "Social Research Planning", "start_date": "01-04-2023", "duration": 5, "order": 10, "progress": 0.4, "open": true },
{ "id": "1", "text": "Choosing Research Problems", "start_date": "01-04-2023", "duration": 2, "order": 10, "progress": 0.6, "parent": "10", "priority": "high" },
{ "id": "2", "text": "Formulating Research Design", "start_date": "03-04-2023", "duration": 3, "order": 20, "progress": 0.6, "parent": "10", "priority": "high" },
{ "id": "20", "text": "Conducting Research", "start_date": "06-04-2023", "duration": 5, "order": 10, "progress": 0.4, "type": "project", "open": true },
{ "id": "3", "text": "Data Collection", "start_date": "06-04-2023", "duration": 2, "order": 10, "progress": 0.6, "parent": "20", "priority": "low" },
{ "id": "4", "text": "Results Analysis", "start_date": "08-04-2023", "duration": 3, "order": 20, "progress": 0.6, "parent": "20", "priority": "medium" }
],
"links": [
{ "id": 1, "source": 1, "target": 2, "type": "0" },
{ "id": 2, "source": 2, "target": 3, "type": "0" },
{ "id": 3, "source": 3, "target": 4, "type": "0" },
{ "id": 4, "source": 2, "target": 5, "type": "0" }
]
})
That’s how you can add a basic JavaScript Gantt chart to your project. You can download this initialization sample or use it in our snippet tool.
Apart from that, we also want to give some insight into how to make your JavaScript Gantt charts more functional and helpful for end-users.
Configuring Common Gantt Features
It is time to show you how to configure some core features provided in our JavaScript Gantt chart library. In this section, you will learn how to enable sorting and reordering of tasks, inline editing, and custom task colors. Here is an HTML Gantt chart example that you should get in the end.
Sorting Columns
We start with the ability to sort columns in the Gantt grid. This feature is implemented by setting the value of the sort attribute to true in the configuration of Gantt JS.
gantt.init("gantt_here");
End-users will be able to sort the grid data by a particular column in the required order with clicks on its header.
Alternatively, this feature can also be put into action with API calls of the sort() method. More details on this approach can be found in the documentation.
Tasks Reordering
When handling a large number of project tasks, it can be handy to have the ability to vertically reorder tasks using drag-and-drop.
In our Gantt, there is a special branch reordering mode responsible for this feature, which is enabled by setting the value of the order_branch property to true.
gantt.init("gantt_here");
Note that it allows reordering tasks only within the same nesting level i.e. a subtask can not be moved to the position of a parent task. To remove this restriction and allow end-users to place tasks at any tree level, you should apply the order_branch_free option:
When enabled in Gantt charts with plenty of tasks, the branch mode may cause some performance decline. In such cases, you can make use of the marker mode aimed at speeding things up.
You can also prohibit placing tasks in other sub-branches with the onBeforeTaskMove event:
const task = gantt.getTask(id);
if(task.parent != parent)
return false;
return true;
});
Tasks Coloring
Coloring tasks is a simple but effective way to focus users’ attention on specific tasks. For instance, you can use various colors for tasks in the Gantt timeline to emphasize their priority. With our Gantt component, you can do it by applying the task_class template. It returns a custom class name for tasks and then this name is used as a selector in CSS for adding custom styles.
body,
html {
width: 100%;
height: 100%;
margin: unset;
}
.red_color {
background: red;
}
.blue_color {
background: blue;
}
.gray_color {
background: gray;
}
.gantt_task_progress {
background-color: rgba(33, 33, 33, 0.17);
}
</style>
switch (task.priority) {
case "high":
return 'red_color'
case "medium":
return 'blue_color'
case "low":
return 'gray_color'
}
}
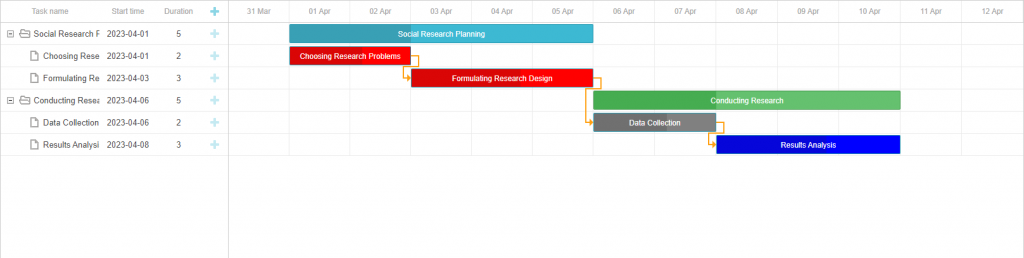
In this example, we show tasks in three custom colors that correspond to certain priority levels – high, medium, and low.
Inline Editing
Inline editing is an essential feature that gives end-users the possibility to introduce various changes in the grid area on the fly. The DHTMLX JavaScript Gantt library comes with several built-in editors that allow changing different types of data such as text, date, number, etc.
Programmatically, you have to define the needed editor type in the column configuration with the editor property.
{name: "text", tree: true, width: '*', resize: true, editor: textEditor},
{name: "start_date", align: "center", resize: true, editor: dateEditor},
{name: "duration", align: "center", editor: durationEditor},
{name: "add", width: 44}
];
The editor object must include the type property, matching the desired editor type, and the map_to property that specifies the property of the task object, where the editor will store values. That is how you can configure editors for columns with text, dates, and duration of tasks:
const dateEditor = {
type: "date", map_to: "start_date", min: new Date(2023, 0, 1),
max: new Date(2024, 0, 1)
};
const durationEditor = { type: "number", map_to: "duration", min: 0, max: 100 };
Auto Scheduling
As a cherry on top, we would like to share with you how to complement your Gantt with some advanced features such as auto-scheduling. For this purpose, you should enable the auto_scheduling extension via the gantt.plugins method:
auto_scheduling: true
});
In addition, it is also necessary to set the auto_scheduling property to true:
Thus, all project tasks will be scheduled automatically depending on the relations between them, like in this JavaScript Gantt chart example with time constraints.
Please bear in mind that the auto-scheduling feature is available in the PRO edition of the DHTMLX Gantt library only.
React, Angular, and Vue Wrappers for DHTMLX Gantt
When it comes to integrating DHTMLX Gantt into projects based on popular front-end frameworks, you can do it via direct low-level integrations of the JavaScript Gantt component. But this option takes more time for writing boilerplate code to handle lifecycle events and component cleanups manually. That is why we recommend using official wrappers specifically designed to ensure a more native development experience when adding the Gantt functionality to React, Angular, and Vue apps.
These wrappers facilitate the integration process by allowing you to use framework-native patterns and practices while retaining full access to the underlying JavaScript Gantt instance.
AI-Assisted Development and Smart Features for DHTMLX Gantt
AI technologies continue to gain momentum in web development. Development teams actively integrate AI coding assistants into their workflows, while businesses see great potential in AI-powered features that promise productivity gains and lower operating costs.
We are cautiously optimistic about AI and closely analyze its impact on modern web development. AI tools do not currently give a fail-safe recipe for success, but they are certainly worth exploring and trying in action.
That is why we are actively engaged in creating favorable conditions for AI-driven development with DHTMLX components. If you rely on any popular coding assistant (Claude Code, Cursor, Gemini CLI), you can ensure that it has access to the latest Gantt documentation and relevant samples by employing the official DHTMLX MCP server. To make AI outputs more reliable, we also offer agent skills for DHTMLX Gantt for JS, React, and Angular. These skills are responsible for informing AI assistants on the main integration patterns and known pitfalls.
If you decide that your Gantt chart JS built with DHTMLX needs additional smart, AI-enabled features, we have a few suggestions implemented in our AI demos:
- AI Gantt Maker – generates Gantt chart HTML configurations from plain text instructions
- AI Gantt Theme Builder – adds required styling patterns in response to natural language prompts
- Gantt with AI Semantic Search – finds project tasks based on their meaning and intent rather than exact keyword matches
Thus, DHTMLX provides you with useful resources to form an intelligent development stack and enrich Gantt-based project planning apps with AI features.
Conclusion
As you can see, DHTMLX can cover all your needs when it is required to complement a web application with a functional Gantt chart. No matter whether you write code in pure JS or any of the top frontend frameworks, the extensive and well-written documentation will give you clear instructions on how to do the job well. With DHTMLX, you also won’t get lost in AI development workflows, thanks to the growing arsenal of AI-related tools and demos. Have any doubts? Download a free 30-day trial version of our Gantt component or any wrapper and test it in your scenarios.