Have you ever tried to describe workflows or business processes for a project in natural language? The chances are high that the efficiency of your work will be very low, as such tasks require special instruments such as a JavaScript data flow diagram. This is one more helpful type of diagram that can be generated with DHTMLX Diagram. Interestingly, it can be done even without writing any code! How? Learn all the details in this post.
What is a Data Flow Diagram
A data flow diagram (generally abbreviated as DFD) is a popular data visualization tool utilized for structured analysis. This type of diagram helps to clearly present transformative processes within a system, collections of data or physical materials manipulated by a given system, and flows of information or material between processes, stores, and the outside world.
DFDs can have multiple levels of decomposition intended for describing some complex processes within a system. These levels vary from a basic one named a context diagram providing a holistic view of data flows with just one key process to more elaborate structures labeled with numbers starting from 0 (low-level DFDs) and complemented with multiple sub-processes. This approach suits well for transaction-processing systems and function-intensive apps.
There are several notations that define special geometric symbols for displaying elements of data flow diagrams. The main visual difference between all notations lies in presenting DFD processes. The two most popular notation types Yourdon & Coad and Gane & Sarson utilize circles and rounded rectangles for this purpose, respectively.
Now let us consider four main components of any JavaScript data flow diagram and some rules that should be taken into account when building this diagram type.
- External entity

It is a diagram element (also referred to as a terminator) that introduces data into the system or gets the processed data from it. Not being part of the system itself, this component reveals how the system communicates with the outside world. Entities can be represented by various objects such as a person, external system, or organization. The unprocessed info cannot be directly exchanged between entities or received by any entity from the system. Entities are depicted with rectangles and named by nouns.
- Process

Any data changes during the information flow occur via processes. It is the most remarkable DFD parameter that receives incoming data and generates output using specific actions (computing, sorting, etc.). The diagram can include one or multiple processes, each manipulating the data in its own way. DFD processes cannot exist without at least one point of input and an output (the same rule applies to data stores). Processes interact via data stores, and not by direct flows between processes. Depending on the notation type, this component can be illustrated with circles or rounded rectangles. As a rule, enumerated “verb + noun” combinations are used to label DFD processes for explaining what happens to the input data.
- Data Store

A data store represents the repository of persistent data in the system that can be retrieved or produced by a given process. Displayed as an open-ended rectangle or two parallel lines, data stores do not operate on their own and always interact with related processes. New data cannot appear in a data store or be moved to external entities or other data stores without being modified.
- Data Flow
It is a directed arrow that indicates the direction of data movement between other elements of the diagram. Each arrow is clarified by text stating what data is being sent/received.
JavaScript data flow diagrams make it much easier to analyze requirements and model systems of various types and complexity levels and help increase their efficiency. DFDs are better than other tools in providing a big-picture view of how data moves through a system. Therefore, this helpful diagram is often adopted by professionals to be applied in different fields such as:
- Software development
- Business analysis
- Project management modeling
Example of a JavaScript Data Flow Diagram by DHTMLX
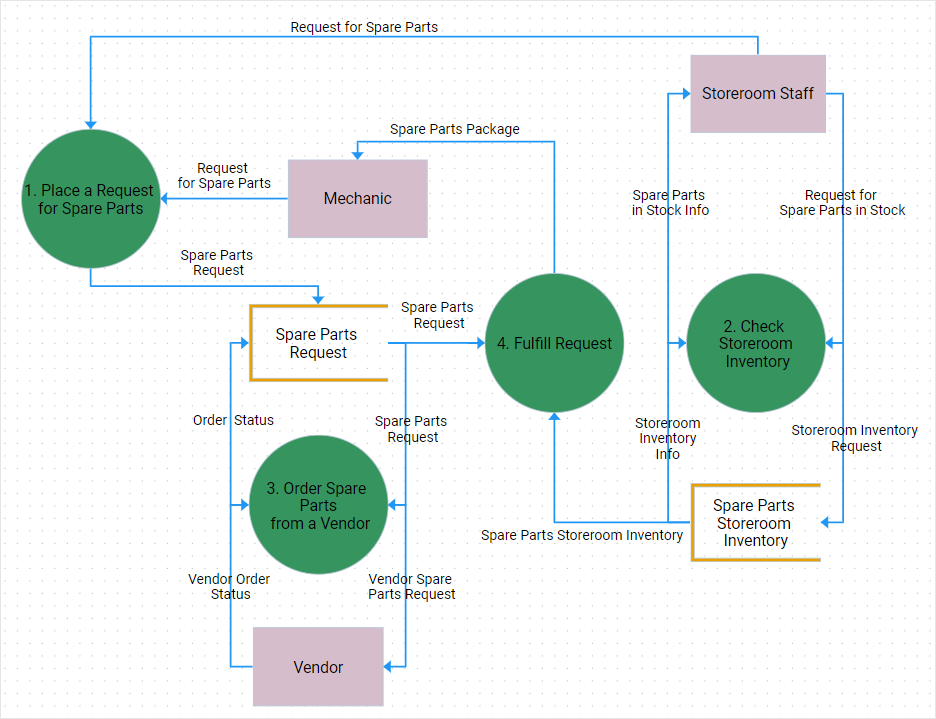
Our sample demonstrates the flow of information and physical materials within a spare parts tracking system in a transportation company using the Yourdon & Coad notation type. The architecture of our level 0 data flow diagram includes the following components:
- External entities (mechanic, storeroom staff, vendor) show how outside parties interact with the system. The mechanic sends a spare parts request and receives a spare parts package. This request is fulfilled using the info on spare parts in stock and ordered spare parts provided by the storeroom staff and the vendor respectively. Entities are depicted in pale-pink rectangles.
- Processes that clearly describe the sequence of actions required for providing a package of spare parts. They are shown with enumerated green circles.
- Data stores serve for saving/retrieving the info on spare part requests and spare parts storeroom inventory. These elements are displayed in the form of open-ended rectangles.
- Data flow specifies the route of information transfer within the system via directed blue lines with clarification remarks.
How to Build a JavaScript Data Flow Diagram with DHTMLX
Apart from a traditional coding approach described in this guide, DHTMLX Diagram enables you to create JavaScript data flow diagrams on the fly using the Diagram Editor.
This feature-packed tool is utilized for building diagrams without coding manipulations. It provides a set of predefined diagram shapes, connectors, and editing options. If you plan to build a data flow diagram in JavaScript with other notation types than Yourdon & Coad, the Diagram Editor can be easily enriched with custom shapes. The editor can be smoothly integrated into any web application and adjusted to its requirements via a flexible API.
A user-friendly interface of the Diagram Editor helps to maximally shorten its learning curve.
Upload the JSON file with the DFD via the import option in the toolbar to DHTMLX Diagram editor and play around with our JavaScript data flow diagram example
Now let us go through key functionalities of DHTMLX Diagram that will help you to build your own JavaScript data flow diagram.
- Arranging the structure of a data flow diagram
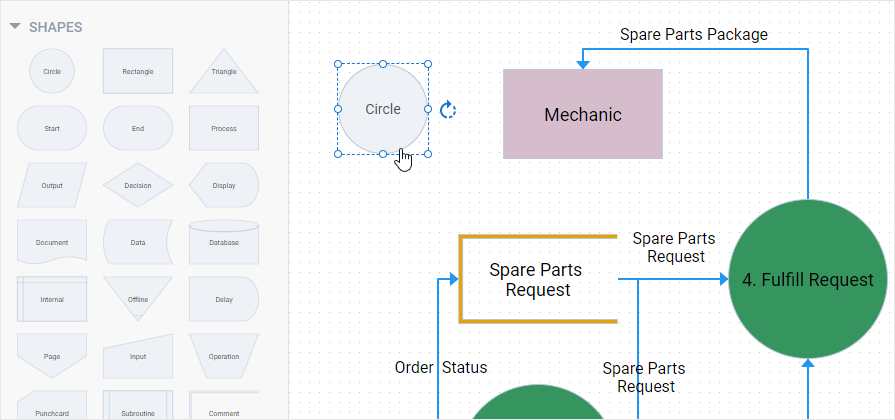
Using the left-side panel you can add all built-in shapes that are necessary for creating a data flow diagram. Just drag a needed shape from the presented list, drop it in the grid area, and position it the right way with the rotating function. As you will require several instances of each DFD shape, you can create copies with the help of the corresponding option that appears when clicking on a shape. It is especially useful if you don’t want to waste time on tuning every shape separately. To link shapes with each other, you should select a connector as shown in the image above.
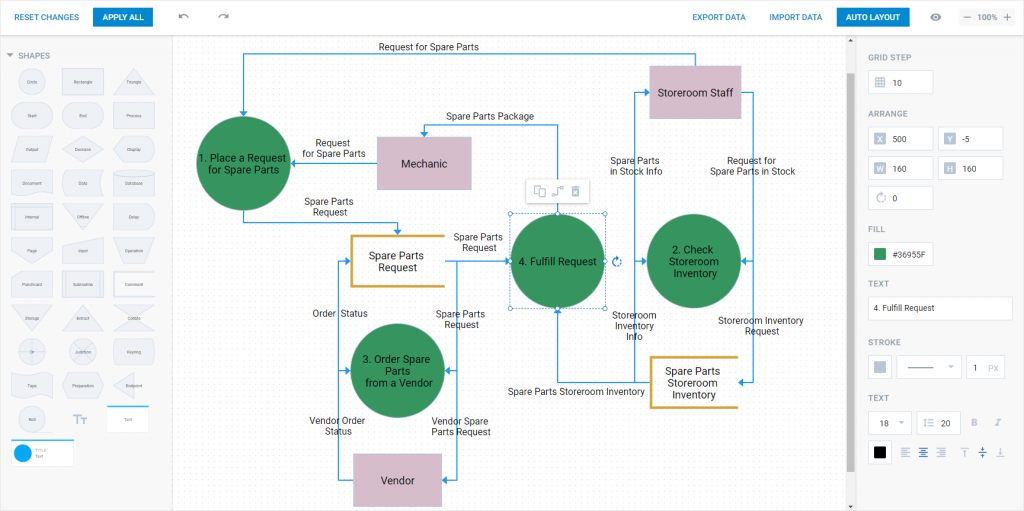
- Editing nodes and connectors of a data flow diagram
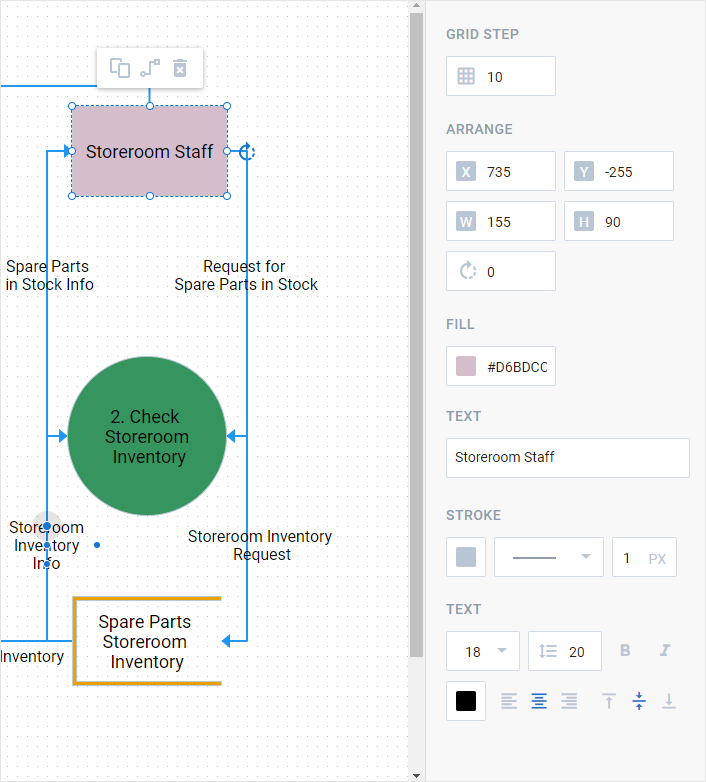
If you want to make your diagram look unique, the right-side panel of the Editor offers plenty of editing options to do that. For instance, you can define dimensions and positioning for each shape more accurately, apply stroke modifications for shapes and connectors, change coloring, and take advantage of numerous text editing capabilities.
- Exporting and importing a JavaScript data flow diagram
Once your diagram is ready, you can share it with others via the exporting feature that allows converting your JavaScript data flow diagram into PDF, PNG, and JSON formats. And if you find new ideas on how to make an already finished diagram better, import your diagram saved in the JSON format into the Editor in a couple of clicks and introduce necessary changes.
As you can see, the Diagram Editor is a simple but effective tool that allows generating nice-looking data flow diagrams for your projects with ease.
Final Words
In this guide, we have reviewed the main peculiarities of a data flow diagram in JavaScript and learned how to create it with DHTMLX.
Summarizing the above, the DHTMLX JavaScript Diagram library can expand your data visualization capabilities in any web project. It comes with a rich and intuitive API for diagramming via coding and provides the Diagram Editor tool for doing the job without programming at all.
Have doubts? Take the opportunity to test DHTMLX Diagram without any payments by downloading a free 30-day trial version.