Great news for DHTMLX Diagram users!
A brand new version of our JS diagram library 2.2 is out. Hurry up to get acquainted with new powerful abilities – adding any custom shapes you wish and building mixed org charts and diagrams.
Download a free 30-day evaluation version of DHTMLX Diagram >
Custom Shapes via SVG and HTML Templates
The release rolls out the most awaited ability to equip DHTMLX Diagrams with any types of shapes you desire. Now your opportunities are not restricted to a range of predefined shapes and you are free to build UML class diagrams, network diagrams, life cycle charts, Venn diagrams, and whatnot.
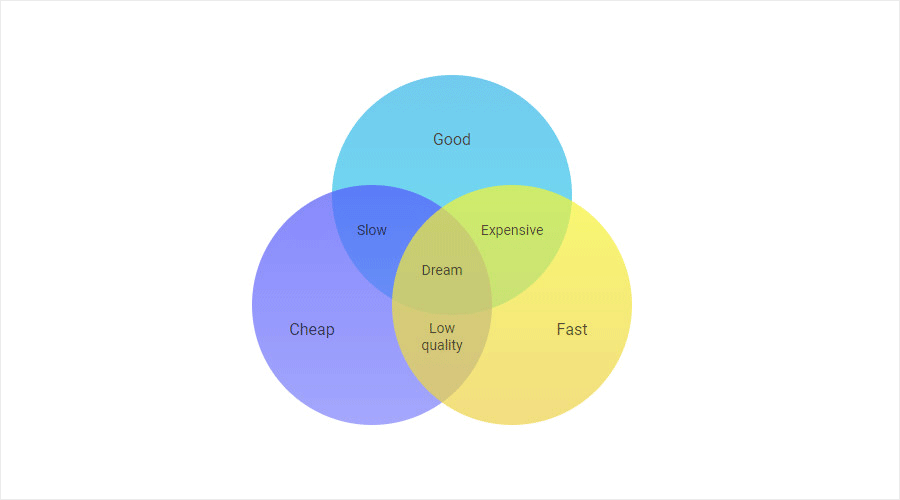 Venn diagrams are designed for finding patterns and defining logical relations among groups of objects, which are usually split into 3 sets. Overlapping areas stand for common characteristics of objects in question. Check the sample >
 Network diagrams usually depict the structure of telecommunication systems. Besides, they can be applied in project management for showing the process flow. Check the sample >
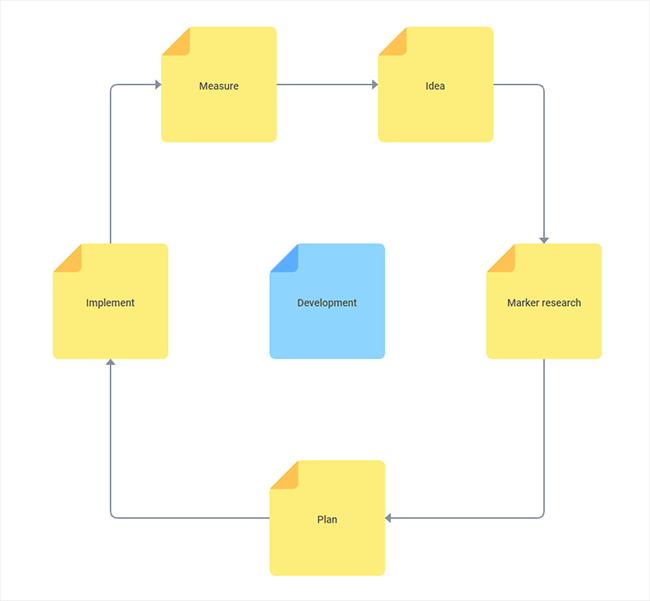 Life cycle diagrams make it easy to illustrate the stages of a product’s or project’s life cycle. In our example, the stages of the development process are designed with the help of yellow sticky notes. Check the sample >
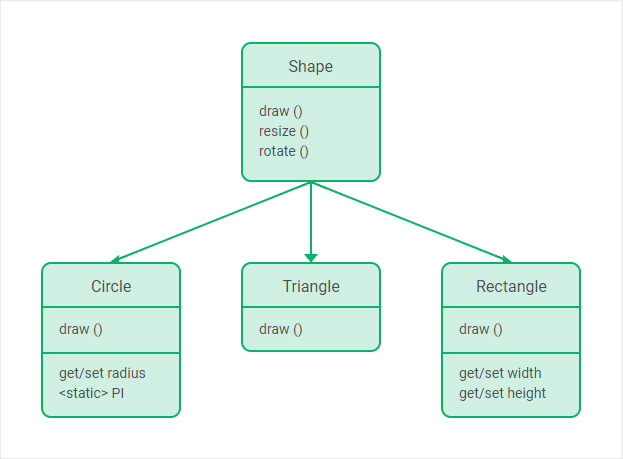 UML Class Diagram for software engineering. Check the samples with HTML template
Embedding custom-made shapes into DHTMLX Diagram became possible due to newly introduced SVG and HTML templates. Now building a custom diagram takes just two steps:
- Create a new SVG or HTML template for shapes:
- Apply the template for the chosen shapes and prepare a data set for loading into Diagram. Check a detailed guide in the documentation >
diagram.flowShapes.customShape = function(config) {
var svg = '<svg width="'+ config.width +'" height="'+ config.height +
'" viewBox="0 0 '+ config.width +' '+ config.height +
'" fill="none" xmlns="http://www.w3.org/2000/svg">';
svg += '<rect width="'+ config.width +'" height="'+ config.height +
'" fill="'+ config.fill +'"/>';
svg += '</svg>';
return svg;
};
or
diagram.flowShapes.customShape = function(config) {
return `
<section style="width:${config.width}px;
height:${config.height}px; background: ${config.fill}">
<span style="font-size:${config.fontSize}px;
color:${config.fontColor}">${config.text}</span>
</section>
`
};
New templates provide you with numerous options not only for adding brand new shapes but also for customizing the existing ones. For instance, you can equip org chart cards with icons, menu items, and any other custom elements required for your project:
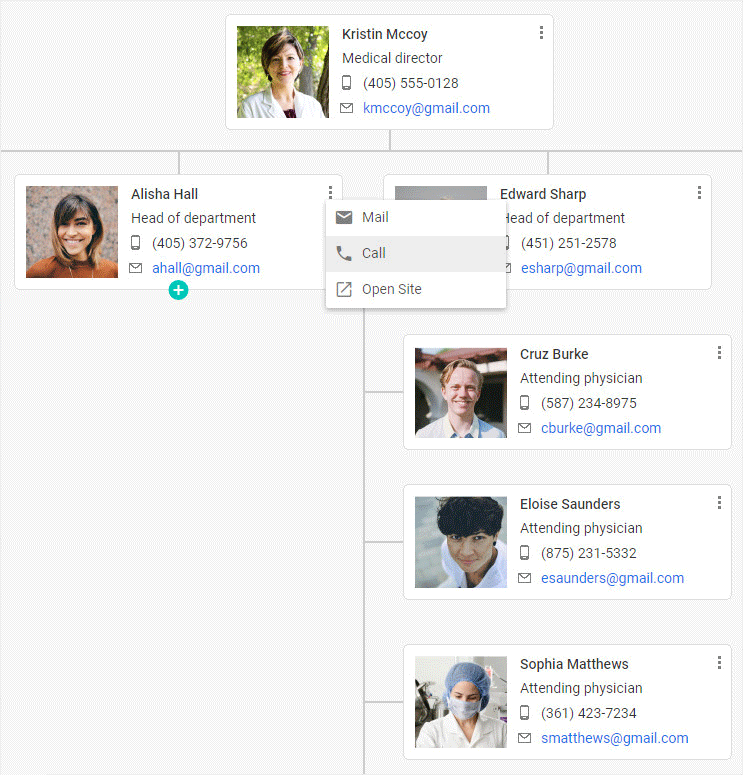 Hospital org chart illustrating medical hierachy. Check the sample >
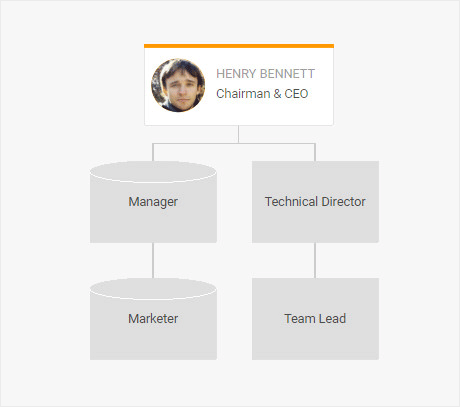
Combining Org Charts and Diagrams
And the cherry on the cake is that DHTMLX Diagram 2.2 enables you to mix flowchart and org chart shapes in one diagram by specifying particular types of shapes for each data item object:
var data = [
// the Org Chart shape
{
id: "1",
text: "Chairman & CEO",
title: "Henry Bennett",
img: "../common/img/avatar-1.png",
},
// the Diagram shapes
{
id: "2",
text: "Manager",
type: "database",
parent: "1"
},
{
id: "3",
text: "Technical Director",
type: "process",
parent: "1"
},
{
id: "2.1",
text: "Marketer",
type: "database",
parent: "2"
},
{
id: "3.1",
text: "Team Lead",
type: "process",
parent: "3"
}
];
// initializing an org chart
var diagram = new dhx.Diagram("diagram", {
type: "org",
defaultShapeType: "img-card"
});
diagram.data.parse(data);
Read detailed instructions in the documentation >
Export Diagrams to JSON from the Editor
Another novelty is the possibility to export your diagrams and org charts into the JSON format right from the editor. Our editors allow you to fine-tune diagrams and org charts on the fly via a simple and intuitive user interface. When you achieve the look and feel you need, you can export the result into the JSON format just in one click. After that, you are free to change our predefined shapes to custom ones using SVG and HTML templates, while preserving the structure and style of the whole diagram. Read more in the documentation >
DHTMLX Diagram 2.2 Round-Up
Summarizing the release news, here’s what you get with the updated Diagram 2.2:
- SVG and HTML templates for adding custom shapes
- The Venn diagram example
- The UML class diagram example
- The Network diagram example
- The life cycle diagram with sticky notes example
- The custom org chart with icons and menu example
- Org charts and diagrams mixed together
- Export to the JSON format right from the editor
We’re looking forward to receiving your feedback about the release of DHTMLX Diagram 2.2. Feel free to share your thoughts and ideas in the comments section below.
If you haven’t tried our Diagram library before, try it out during a free 30-day evaluation period.
We invite our current clients to visit their Client’s Area, where they can download the latest version 2.2.