The major release 3.0 delivered a breakthrough in the functionality of DHTMLX JavaScript diagramming library. The new version introduced an auto-layout algorithm for automatically arranging randomly placed diagram shapes in a neat order in a matter of seconds. Other novelties include a brand new configuration property for applying default settings to all shapes at once, a convenient way of creating custom diagram shapes, and numerous customization options for JavaScript Diagram and Org Chart editors. Besides, it became possible to easily manipulate multiple shapes with the help of multiselection.
Get DHTMLX Diagram 3.0 evaluation version and try out all the new features free of charge for 30 days.
Diagram Auto Layout Algorithm
The highlight of the release is an automatic layout algorithm, which turns chaotically located Diagram shapes into a hierarchical structure.
In order to make it work, you need to add connectors between shapes. The algorithm has two modes, which differ in the way shapes will be connected. The example above demonstrates both the “direct” mode with diagonal lines between shapes and the “edges” mode with shapes with right-angle connectors.
To enable an automatic arrangement of diagram shapes, you need to apply the autoPlace method with two optional configuration settings for specifying the mode of connecting shapes (“direct”, by default) and distance between separate diagrams in case there are several of them on a page (200px, by default). Alternatively, you can add these settings via the autoplacement config. In the code snippet below, we enable the auto layout in the “edges” mode with 300px distance between diagrams:
diagram.data.parse(data);
diagram.autoPlace({
mode: "edges",
graphPadding: 300
});
The diagram layout algorithm is also available in the Diagram editor. The settings of the auto layout can be defined via the autoplacement configuration property as in the example below. Here we have two diagrams: one with square shapes and the other with circle ones situated in random order. The auto-layout algorithm will arrange both diagrams in the “direct” mode with diagonal connectors and 100px distance between diagrams:
autoplacement: {
graphPadding: 100,
mode: "direct"
}
});
Our brand new hierarchical layout algorithm accelerates the creation of beautiful and complex diagrams from the UI. End-users no longer have to spend time and effort in an attempt to place each shape neatly. Now they just need to choose the necessary shapes from the right panel, connect them to each other, and press the Auto Layout button to achieve an orderly look and feel:
One Property for the Default Configuration of All Shapes
DHTMLX diagramming library 3.0 introduced a new configuration property, which alone is able to save you lots of time and effort when you are creating a complex diagram with a big data set. The new defaults config can encompass almost all configuration options of different types of shapes significantly reducing the size of your code.
Let’s take a closer look at it in the following example:
start: {
fill: "#FE9998",
stroke: "#FE9998",
fontColor: "#FFF",
lineHeight: 16
},
end: {
fill: "#FE9998",
stroke: "#FE9998",
fontColor: "#FFF",
lineHeight: 16
},
process: {
fill: "#478D99",
stroke: "#478D99",
fontColor: "#FFF",
lineHeight: 16
},
decision: {
fill: "#F7D768",
stroke: "#F7D768",
fontColor: "#FFF",
lineHeight: 16
},
document: {
fill: "#478D99",
stroke: "#478D99",
fontColor: "#FFF",
lineHeight: 16
}
};
const diagram = new dhx.Diagram("diagram", {
defaults: defaults
});
diagram.data.parse(activity);
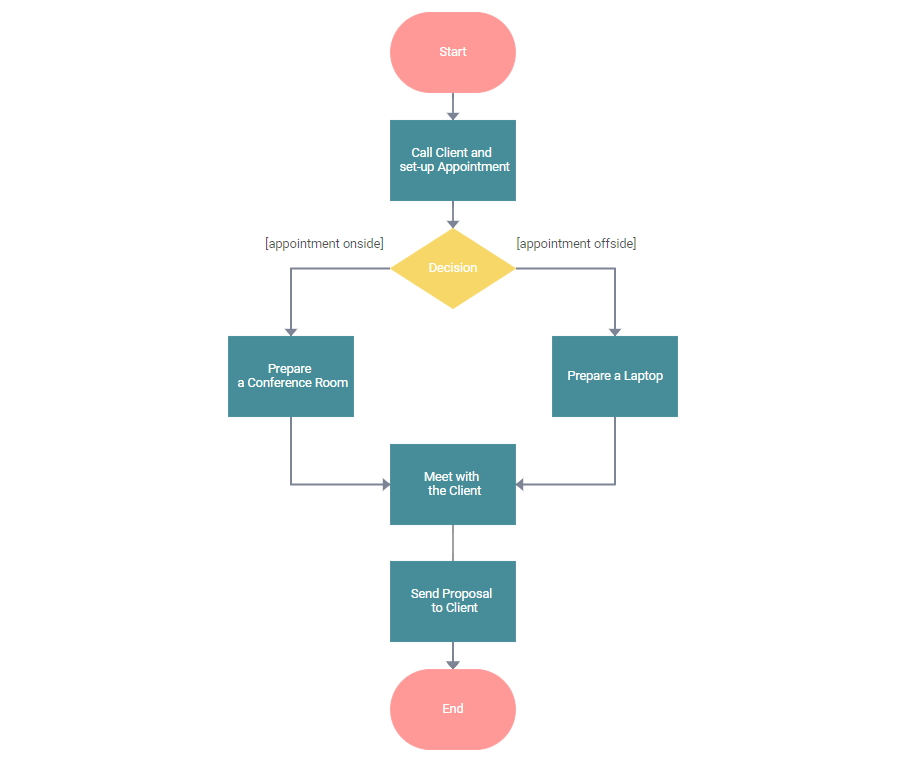
In the picture above you can see an Activity diagram depicting a flow of business activities. The defaults config contains a set of default configuration options for each flowchart shape used in this diagram. For instance, all Process shapes are colored in cyan (#478D99), with white font, and fixed line-height (16px). Even if we enlarge the data set with hundreds of new activities to be illustrated with Process shapes, our code will still remain as neat and concise as before.
New Simple Method to Create Custom Shapes
V3.0 delivered a new API method for easily creating custom Diagram and Org Chart shapes. The new addShape method enables developers to specify a unique template for a newly added shape, which can contain any custom elements like images, icons, or other custom content. Optionally, you can set the default configuration of shapes with the help of the defaults property.
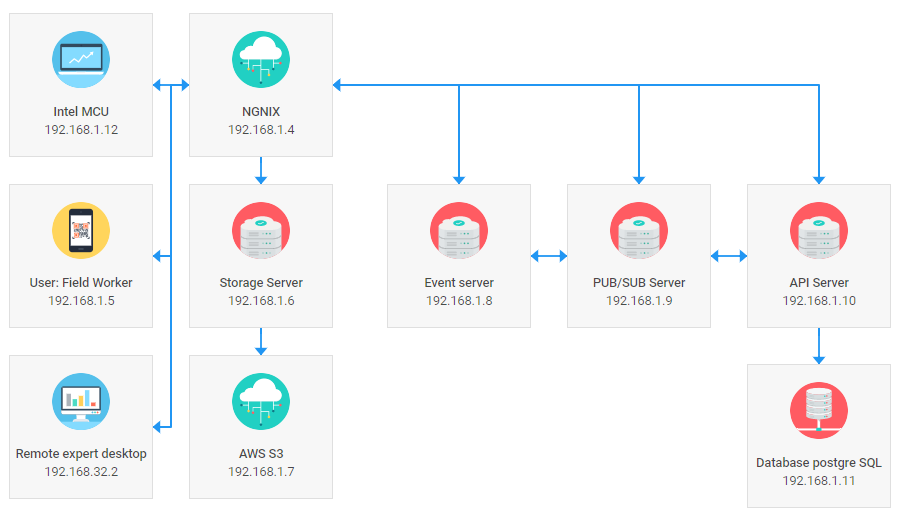
Below you can see a code example of how to create a custom shape with the help of the addShape method for a Network diagram. Here we use an HTML template, according to the ES6+ standard, to define which custom elements to include in a shape: image, text, and string of numbers for IP address. We specify the defaults config to add the default properties of a Network diagram shape such as width, height, image path, text, and IP address. These properties can be overridden in the configuration of each particular shape if needed:
template: config => (
<section class='network_template'>;
<img src='${config.img}’ alt='${config.text}’'></img>
<span>${config.text}</span>
<span>${config.ip}</span>
</section>
),
defaults: {
width: 160,
height: 160,
img: "../common/img/network_image/desktop.svg",
text: "Network Card",
ip: "138.68.41.78",
}
});
Thus, you can create a slick Network diagram like in the picture below:
 Check the sample >
Adding Custom Shapes into Live Diagram Editors
The addShape method also serves to quickly add custom shapes into live Diagram and Org Chart editors. All you need to do is to set the addShape method in the editor configuration object and apply the desired template with the default settings (if needed). The icing on the cake, all custom shapes will be automatically rendered in the editor’s left panel as shape previews.
Customization options delivered in v3.0 let you fine-tune the look and feel of Diagram and Org Chart editors. You can tailor-make the editors’ left and right panels entirely to your needs.
Customizing the Left Panel
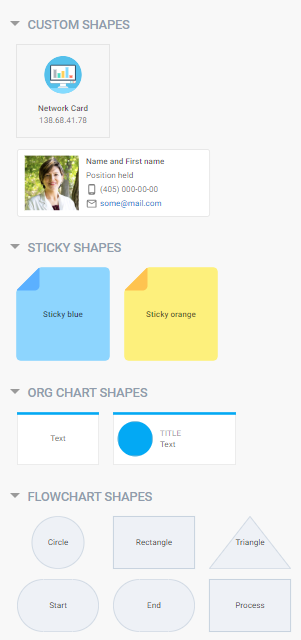
The new shapeSections configuration property enables you to categorize all shapes into several groups and show them in corresponding sections in the left panel of the Diagram editor. Additionally, you can control how shapes are previewed there.
In the example below, we added four sections with previews for Custom, Sticky, Org Chart, and Flowchart shapes. Besides, we made use of the scalePreview configuration option to define the size of a shape preview:
shapeSections: {
"custom shapes": ["networkCard", "medCard"],
"sticky shapes": ["blue", "orange"],
"org chart shapes": ["card", "img-card"],
"flowchart shapes": [true],
},
scalePreview: 0.65,
});
Alternatively, it’s possible to add an image instead of an automatically rendered shape preview with the help of the preview property of the defaults attribute for previewing a particular shape. The width and height parameters can be specified to define the size of an image preview.
Moreover, you can change the distance between shape previews using the gapPreview property and specify the width of the left panel using the shapeBarWidth configuration property.
Customizing the Right Panel
The right panel of the Diagram editor will automatically render sidebar options for editing custom shapes with standard attributes like title, text, fill, stroke, etc. depending on the dataset of a shape, as shown in the example above.
However, dealing with complex custom shapes you might need to equip the editor with special tools for modifying various custom elements in Diagram and Org Chart editors. For that purpose, we introduced the properties attribute of the addShape method, which allows changing the sidebar options available for editing by end-users in the right panel.
For instance, here is an Org Chart editor with custom shapes to illustrate the hierarchy of a medical establishment:
Custom Org Chart shapes contain several text elements for a doctor’s name and position, fields for a phone number and email address, and a photo. Each element can be edited from the UI due to a range of editing tools in the right panel. As you can see in the code example, the properties attribute includes options for defining the shape’s position and size, doctor’s name, post, phone number, and email address as well as a photo to be loaded into the chosen shape. Editing options are represented in the sidebar exactly in the same order in which they are specified in the properties attribute:
template: template,
defaults: {
name: "Name and First name",
post: "Position held",
phone: "(405) 000-00-00",
mail: "some@mail.com",
photo: "../common/big_img/big-avatar-1.jpg",
height: 115, width: 330
},
properties: [
{ type: "position" },
{ type: "size" },
{ type: "text", label: "name", property: "name" },
{ type: "text", label: "post", property: "post" },
{ type: "text", label: "phone", property: "phone" },
{ type: "text", label: "email", property: "mail" },
{ type: "img", label: "photo", property: "photo" }
]
});
Additionally, now you can define which controls to make available in the Editor via the controls property. For instance, you can enable the Import and Export controls, the Grid Step option, which sets the step of moving shapes, the Auto Layout control, and the Edit Mode button, and disable the Undo and Redo, Apply and Reset changes buttons:
controls: {
import: true,
export: true,
gridStep: true,
autoLayout: true,
editMode: true,
historyManager: false
apply: false,
reset: false
},
});
Multiselection of Shapes
Another significant enhancement in the work of editors is the ability to manipulate several shapes and connectors at once. V3.0 brought out the multiselection feature for dragging, copying, pasting, and deleting shapes. To select multiple shapes, you can either hover the mouse over them while keeping the left mouse button pressed or left click on each shape while pressing Shift.
New Use Cases for Searching and Zooming in Diagrams
We prepared a couple of new samples covering the most popular cases of using JavaScript diagrams, according to our users’ requests.
One of the demanded examples is implementing a search functionality for navigating through vast Diagrams and Org Charts:
 Check the sample >
Another sample demonstrates how Org Chart shapes change their appearance depending on the scale while zooming in and out:
 Check the sample >
We do hope that the new functionality and samples of DHTMLX Diagram 3.0 will come in useful in your applications. Dive into the new features by downloading a free 30-day trial version and benefit from the assistance of our technical support team if any questions arise.
We’ll be looking forward to your feedback – leave your comments below!
Current clients are invited to get the latest version of DHTMLX Diagram in their Client’s Area.
Stay tuned for future updates!
Related Materials:
- Full “What’s new” list
- Diagram 3.0 samples
- Free 30-day trial version