Updated on May 5, 2026
In many articles on project management, the term “timeline” has become a universal concept referring to various tools for visualizing activities over time. It often refers not only to a simple timeline chart focused on visual representation, but also to a more advanced instrument like a Gantt chart, which is used for actual project planning and coordination. These tools are timeline-based, but they are fundamentally different when talking about their practical implementation and end use.
In this post, we look at the differences between Gantt and timeline charts in structure, behavior, and real-world use. One more important goal for us here is to highlight what developers should keep in mind when adding these functionalities to web apps.
What is a Timeline Chart
A timeline chart (or diagram) is a basic visual tool commonly used in PM projects to clearly illustrate the chronological sequences of project tasks, milestones, and deadlines over time. This type of chart is also often encountered in marketing campaigns, product launches, historical overviews, and other scenarios that require a simple visualization of time-based data.
Timeline layouts represent time ranges along a linear time axis, which can be arranged horizontally or vertically, with all relevant activities pinned to it based on when they should occur (or already occurred). Here is a basic example of the timeline chart built with the DHTMLX Diagram editor in a code-free way:
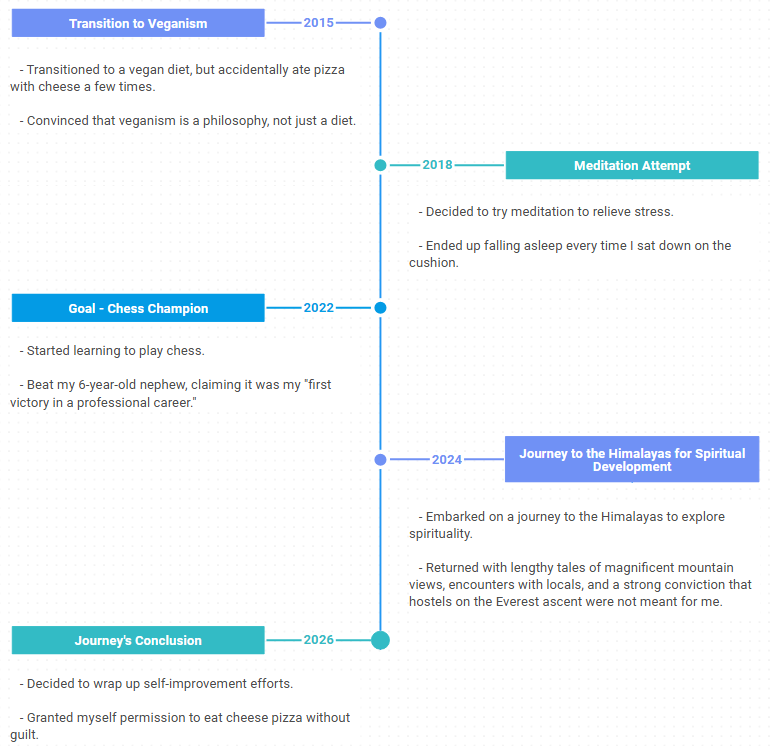
In some cases, charts may omit a labelled time axis, but still maintain a clear, chronological order. For instance, here is a high-level roadmap for participants of the DHTMLX Startup program that offers a 70% discount for our top UI components to speed up time to market for young businesses.
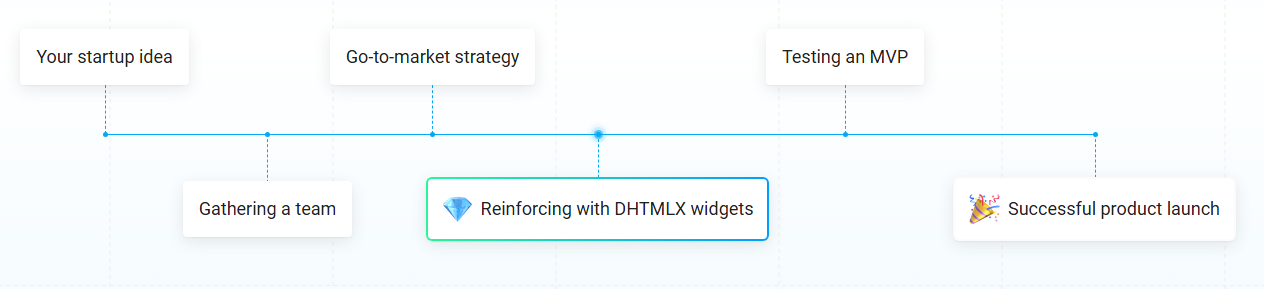
As you can see from this example, timeline charts usually do not focus on detailed information for items in the sequence, but may include short descriptions with visual elements such as markers or images. This kind of visualization does not require complex logic or anything that affects the dataset structure. The main objective here is to keep visualizations explicit and easy to interpret, so there is no confusion concerning what happens, in what order, and when.
Where Timeline Charts Don’t Work Well
The simplicity of timeline charts is often considered their key strength, but it also defines the limitations of this tool. It does the job well for presentations and stakeholder updates, but it becomes insufficient when your app needs to visualize and manipulate data in various ways.
Specifically, you should not rely on traditional timeline charts for:
- dealing with dependency links,
- resource allocation,
- and dynamic updates.
Once your use case involves coordination between elements rather than just presentation, it is a clear signal that you need a more functional tool.
What it Takes to Build a Timeline Chart
From a development perspective, building standard timeline charts rarely causes any issues. The whole process is quite straightforward and includes the following points:
- a flat dataset (typically an array of events in JSON format)
- a rendering layer that maps data directly to UI
- minimal state management
- little to no business logic beyond formatting and positioning
When put together, these points describe a very predictable setup. Most timeline implementations follow a simple pipeline, where data is passed directly to the UI with almost no transformation along the way. This is exactly why timelines feel so lightweight. It mostly translates data into a visual layout without needing to maintain or evolve that data over time.
What is a Gantt Chart
A Gantt chart is a time-tested project planning tool that illustrates a project tasks, their duration, order, and dependencies over time. Structurally, it typically comprises a timeline with a grid panel, where project stages (tasks, milestones, etc.) are depicted alongside their schedule, making it easy to see both timing and relationships between activities.
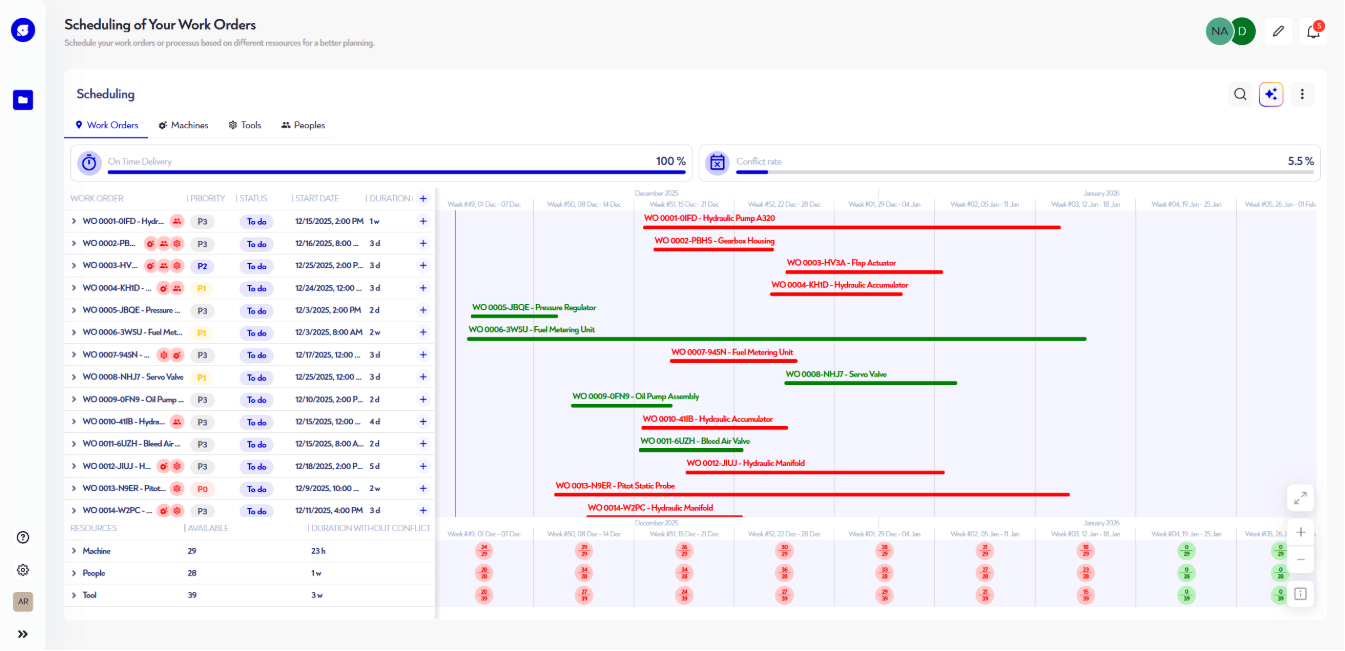
In modern project management apps, JavaScript Gantt charts serve as a comprehensive system, enabling project managers to plan, adjust, and track complex workflows as they evolve. For instance, Gantt charts are frequently used in solutions for construction businesses, industrial manufacturers, logistics, and many other scenarios.
What Makes Gantt Fundamentally Different
The most obvious distinction of this project management tool lies in the wide range of operations available for handling tasks in the UI, including:
- defining various types of tasks and dependencies between them,
- adding durations and progress tracking,
- specifying hierarchical relationships (parent and child tasks).
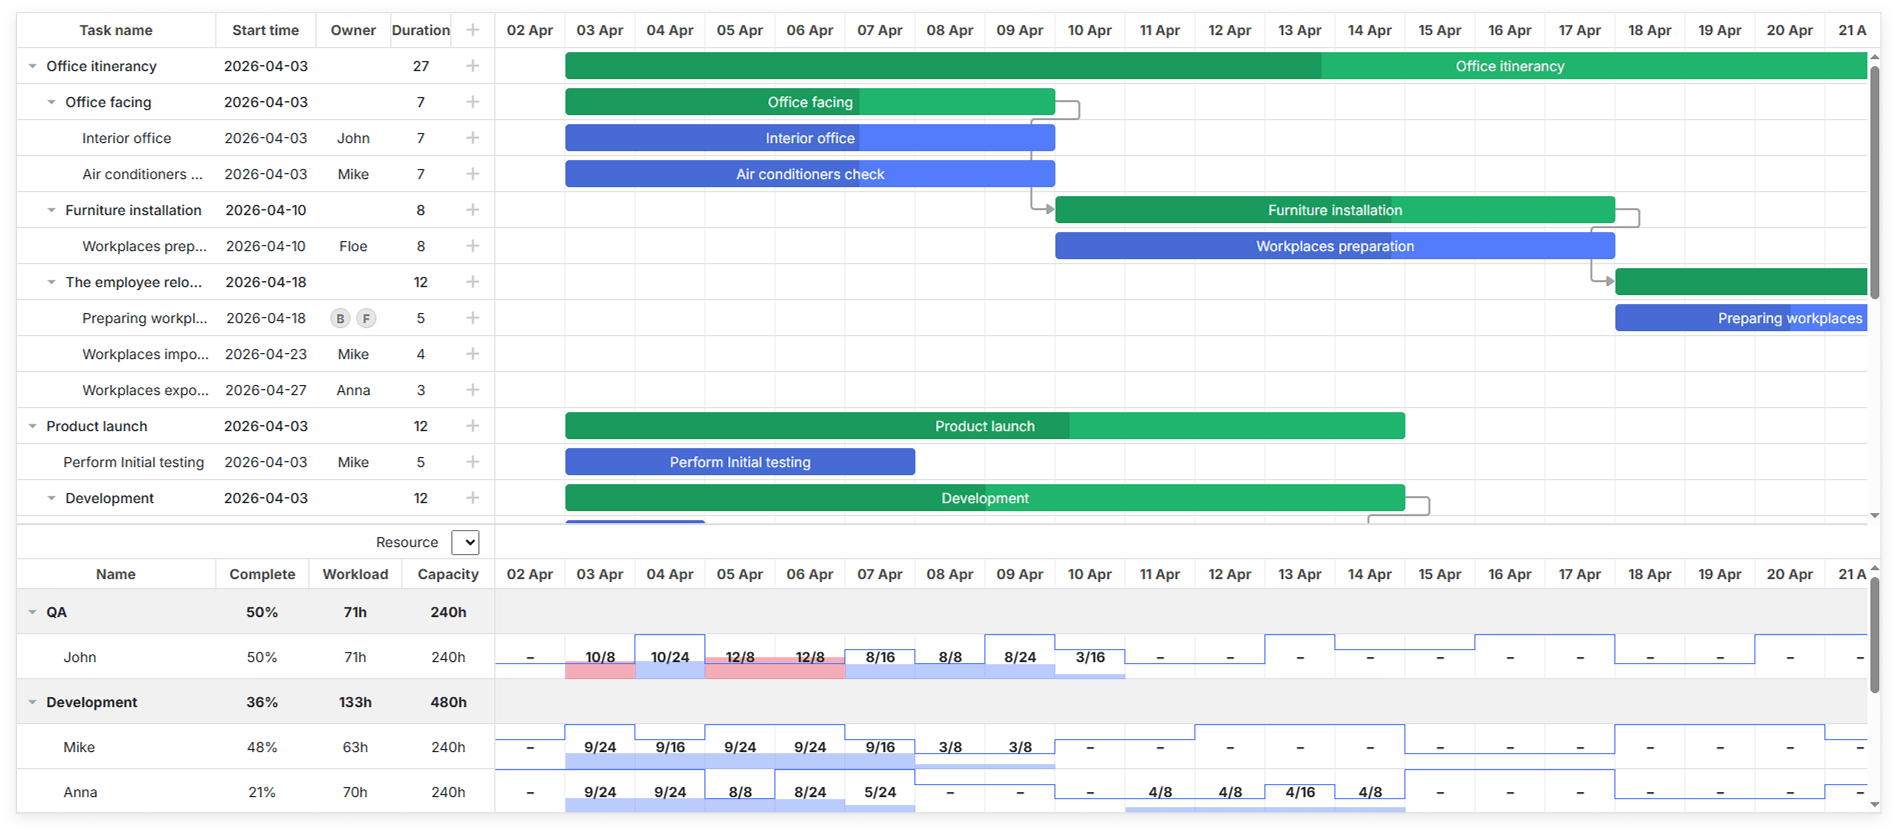
Visually, tasks appear as horizontal bars stretched across the timeline, with their length reflecting how long they take. But the thing that really matters here is what happens when something changes. For instance, if a user drags a task a little bit, all items linked to it may shift as well. Any duration changes also affect linked tasks. Thus, it becomes clear that the chart displays not only the data, but also follows the rules behind it.
Why Gantt Chart Continues to be Highly Demanded in Modern Apps
Despite the growing complexity and data intensity of modern projects, the Gantt chart remains highly effective and is considered a safe pick by many teams. This is largely thanks to advanced features that stem from the core ability to set task dependencies (or relationships). For instance, task dependencies serve as a foundation for the following capabilities:
- critical path – the sequence of tasks that determines the shortest possible project duration
- auto-scheduling – a rule-based computational process used to bring all interrelated tasks up to date when relevant changes take place in any of them
- resource allocation – distribution of work (tasks) among available resources
These features often become a game-changer in large projects, helping teams to quickly understand what happens when the project plan changes and saving teams a lot of time in manual labor.
Why is It a Challenge to Build a Functional Gantt Chart from Scratch
After reading about the advanced features currently available in Gantt charts, you may probably guess that the practical implementation of this functionality can be an extremely challenging task. And your instincts are right here, especially when building a Gantt chart from scratch.
Contrary to a traditional timeline chart, the Gantt chart architecture usually follows a particular behavior pattern (feedback loop):
Current project data (tasks, links, resources) → UI → user action → recalculations via the scheduling engine and dependency logic → state update → UI re-rendering → next user action.
Combining these pieces into a seamless workflow rarely happens without a hitch and requires a more thoughtful approach.
Timeline vs Gantt: What Developers Should Bear in Mind
At this point, it should be clearer to you how these tools are structured and how they operate in real-case scenarios. We also lightly touched on the subject of adding these functionalities to web apps. To consolidate your understanding of the implementation part, let us highlight one more time the key points on the differences between these tools under the hood:
| Criteria | Timeline chart | Gantt chart |
| Data model | Flat events | Structured tasks with hierachies |
| Data flow | One-way flow | Feedback loop |
| Dependencies | Not supported | Supported |
| Interactivity | Low | High |
| Handling changes | Manual updates | Built-in logic for automatic adjustments |
| State management needs | Minimal or none | Requires continuous data synchronization |
| Risk of underestimating complexity | Low | High |
In simple terms, if you are wondering when to use a Gantt chart vs a timeline, you should opt for a timeline chart when your project needs a straightforward way to visualize data over time, while a Gantt chart is a safe bet for actively managing data.
Save Time and Build with DHTMLX
Time is the most valuable resource for development teams. The more complex the required functionality is, the less sense it makes to build everything from scratch. A standard timeline chart is a manageable task, but it still takes time and effort to achieve consistency in the UI design. But a Gantt chart is an entirely different story. Implementing things like drag-and-drop behavior, dependencies, and resource allocation by yourself is a risky undertaking that often comes at a high cost.
That is why many teams see value in using ready-made UI components like DHTMLX. If you need a timeline chart, you can build it with DHTMLX Diagram. For feature-packed Gantt chart scenarios, you can totally rely on our time-tested JavaScript Gantt component. Both components can be thoroughly tested thanks to the availability of free 30-day trial versions.