<

JavaScript Network Diagram

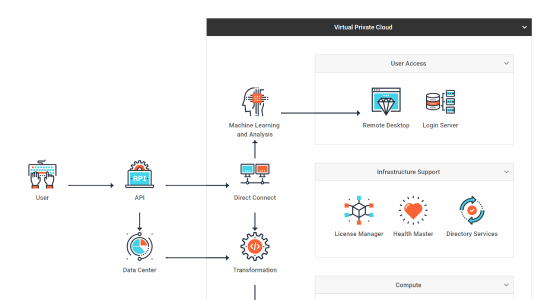
A network diagram is meant for visualizing relationships and interactions among various components within a network, such as computers, servers, routers, and other devices. On this page, you’ll find a network diagram template built with DHTMLX Diagram, key features, and integration guides with React, Angular, and Vue.js.

Open a demo on desktop
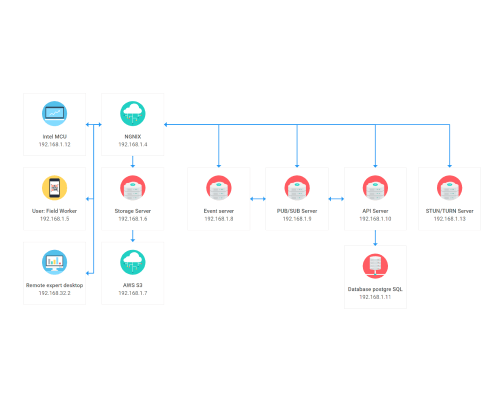
This network diagram is built with the help of the DHTMLX Diagram library.
Get a 30-day trial to test this demo and 20+ others in your projects free of charge.
Get free trial
Contents
Contents
This network diagram is built with the help of the DHTMLX Diagram library.
Get a 30-day trial to test this demo and 20+ others in your projects free of charge.
Get free trial

What Network Diagrams Are and How to Use DHTMLX JavaScript Network Diagram Library with Your Web Application

A network diagram helps to represent the structure of computer or telecommunication systems of any complexity level, from basic networks to complex cloud-based storage systems. It uses different shapes to depict network components and lines/connectors to explain relationships between them.

Network diagrams are essential tools for network administrators, engineers, and other IT professionals as they provide a visual aid for planning, designing, implementing, and troubleshooting networks effectively. They help in visualizing complex network configurations, identifying potential issues, optimizing network performance, and documenting the network for future reference.

Besides, network diagrams are beneficial for use in project management. With a project management network diagram, specialists can vividly illustrate each project stage, determine the workflow of different project activities, monitor the project progress, perform time estimates, etc.

With DHTMLX, developers can easily build interactive JavaScript/HTML 5 network diagrams and customize them to suit the specific needs of their project. The library comes with a rich and flexible API enabling smooth configuration. As a pure JavaScript library, DHTMLX Diagram can be seamlessly integrated with various technical stacks, including React, Angular, and Vue.js frameworks and TypeScript.
Key Features of DHTMLX JavaScript Network Library

Customizable nodes and connectors

You can customize the appearance of network diagram shapes and connectors using various options described in the Diagram API. There is also the option to make your JavaScript network graph more visually appealing by setting up attributes for its elements via CSS. You can specify colors for the shape background and border, align shape items and textual data, etc.

Template for custom shapes

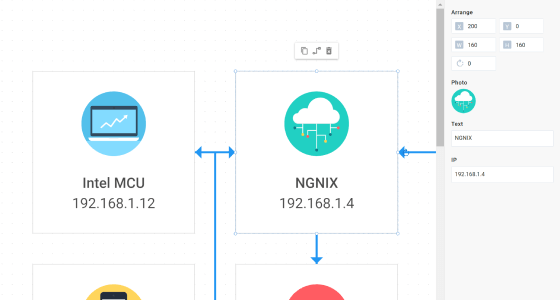
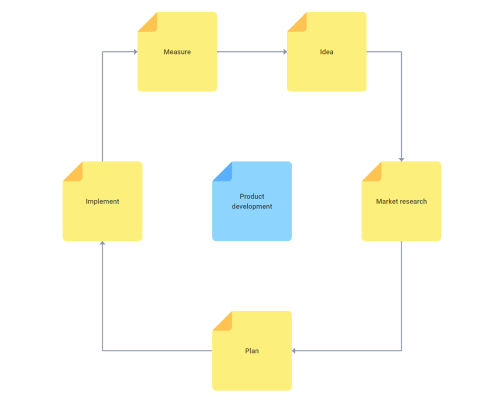
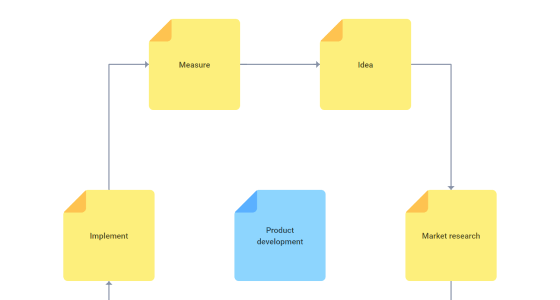
DHTMLX Diagram allows creating HTML network diagram shape templates. You can define all necessary content for the custom shape, including an image to show a specific network component, its name, and IP address. Besides, you can add non-standard shapes, e.g. sticky notes, to use them when building a life cycle network diagram for project management.

Inline editing

By default, DHTMLX Diagram supports inline editing. End-users have the option to add, delete, and modify the text content of network diagram shapes and connection lines with ease by double-clicking on them.

Networking diagram shapes grouping

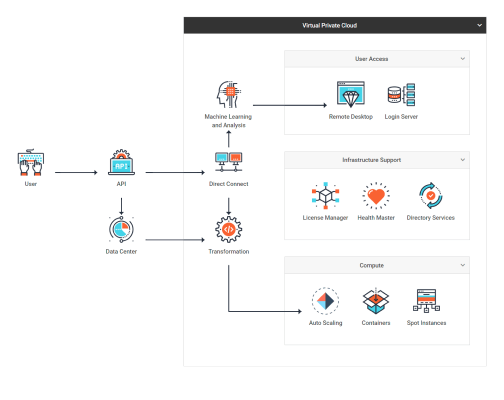
You can draw simple or more complicated js network graph examples by grouping shapes. Thus, for example, you can create one-level groups as well as nested groups and configure their look and feel.

You have the option to add a header to your group and attach an icon to it thus allowing end-users to collapse and expand the group. It’s also possible to drag and drop any child shape between different groups. The behavior of group items is configurable, so you can modify the default settings according to your project requirements.

Searching for a shape

DHTMLX Diagram offers a range of API endpoints designed to make end-users experience smoother and more convenient when working with network diagrams. For example, you can add a feature of searching a shape on request, thus streamlining the process of managing data-intensive diagrams.

Zooming and scrolling

In addition to searching the network diagram js shape, you can implement zooming and scrolling features for effective navigation. This allows end-users to seamlessly zoom in or out or move across the network graph using horizontal and vertical scrolls.

Configurable shape toolbar

With DHTMLX Diagram, you can add a toolbar to edit diagram shapes. This element can display various icons, providing end-users with specific options to manipulate JavaScript network diagram shapes with just a few clicks. For instance, users can duplicate the selected shape, set connections between different shapes, or delete it.

Export to PDF/PNG

By default, the DHTMLX Diagram library comes with an online export to PDF and PNG formats. However, you can buy and set up a local export module. Read more about Diagram exporting options here.

Localization

The Diagram editor interface is initially designed for English-speaking users, however, it’s adaptable to different locales. You can use the Diagram API to provide the appropriate labels to translate the JavaScript network diagram builder interface according to your project needs.

JavaScript Network Diagram Integrations

Integrating the DHTMLX js network graph library into any web app is a seamless process. You can rely on code snippets and ready-made demos on GitHub to integrate network diagrams with Angular, Vue,js, and React as well as use the library with TypeScript.

Live demo
Using DHTMLX network diagram with
GitHub demo
Using DHTMLX network diagram with
Guide
TypeScript support
Network Diagram Examples
Take your data visualization to the next level with DHTMLX Diagram
Download the DHTMLX trial version and evaluate it free of charge for 30 days benefiting from the official technical support of our team.
NO credit card required