DHTMLX Gantt has gained a great popularity among web developers thanks in large part to its advanced features, and resource management is one of them. It is a vital functionality for many projects when it comes to efficiently utilizing project resources in real time. Our tech support team frequently receives requests for more technical insights on resource planning capabilities with DHTMLX Gantt.
In this post, we’d like to discuss key resource management options of our JavaScript Gantt component highlighted in the new video overview with the help of editable code snippets.
Displaying and allocating resources on-the-fly
When utilizing DHTMLX Gantt in project management apps, it is possible to show all project resources (i.e. employees, equipment, financial resources, etc.) and their current workload. There are two layout views for this purpose – resource load diagram and histogram. They are synchronized with the main Gantt chart, therefore it is very easy to balance the workload with drag-and-drop like it is shown in the video and in the code snippet.
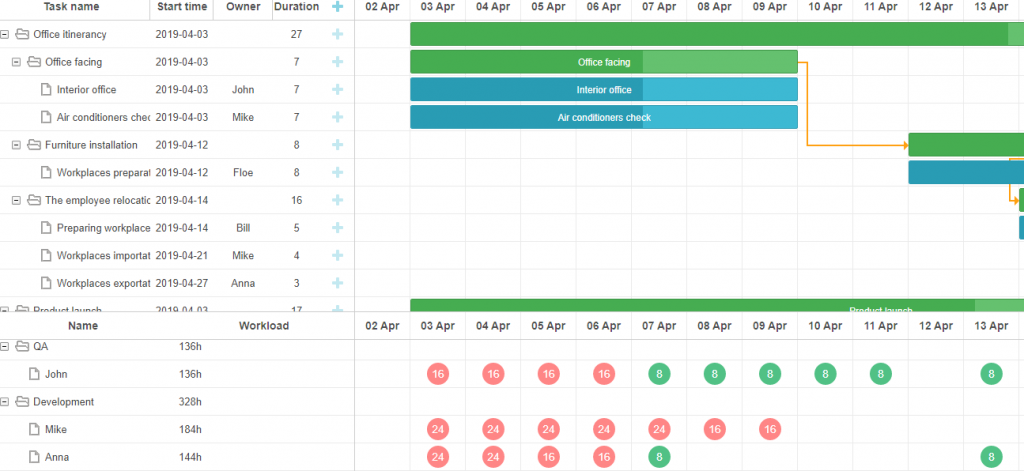
Although the Gantt component allows displaying resource loading and resource allocation, it is important to understand that the calculation logic must be implemented by developers. But our library provides great possibilities for customization and adding your own solution via a public API.
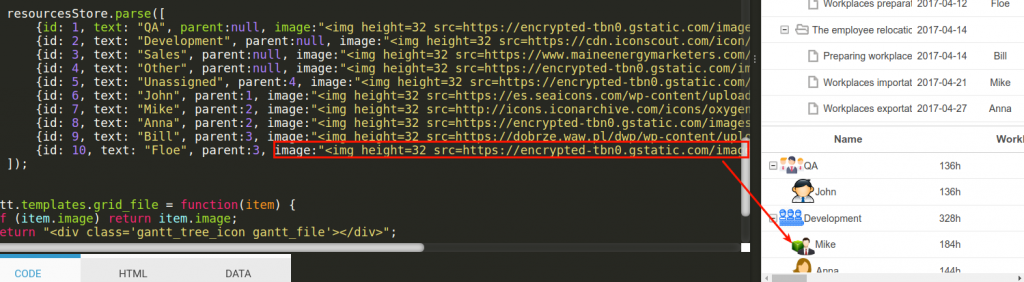
Utilizing custom content
If necessary, you can also complement a resource diagram with custom data or any HTML elements. The snippet gives an example of custom icons applied in the grid of the resource load diagram. To do that, you simply need to modify the grid_file and grid_folder templates.
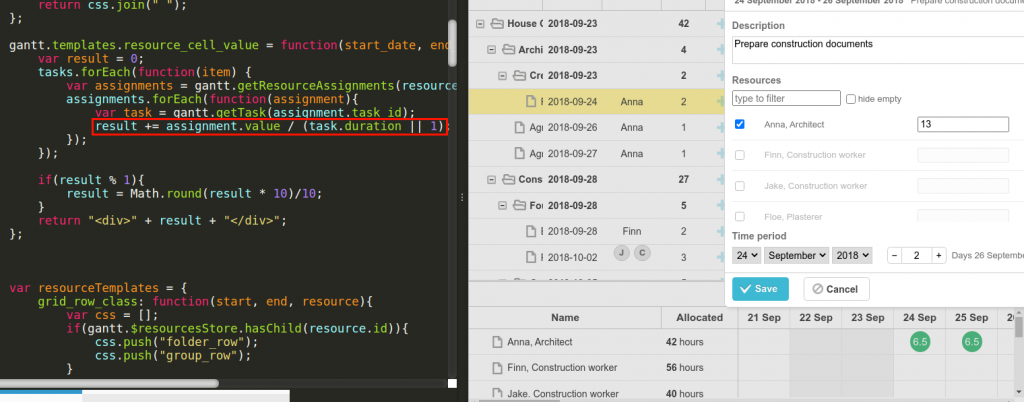
Calculating the workload
Taking advantage of the resource control, you can use our Gantt component to assign multiple resources and set their quantity. It is a helpful approach to indicating resource loading on a particular day. But since DHTMLX Gantt does not calculate the actual resource loading, the resource quantity (for example, working hours) will remain unchanged regardless of the number of tasks assigned to the resource for that day. One of the solutions to this kind of issue is to allocate the assigned number of working hours depending on the task duration.
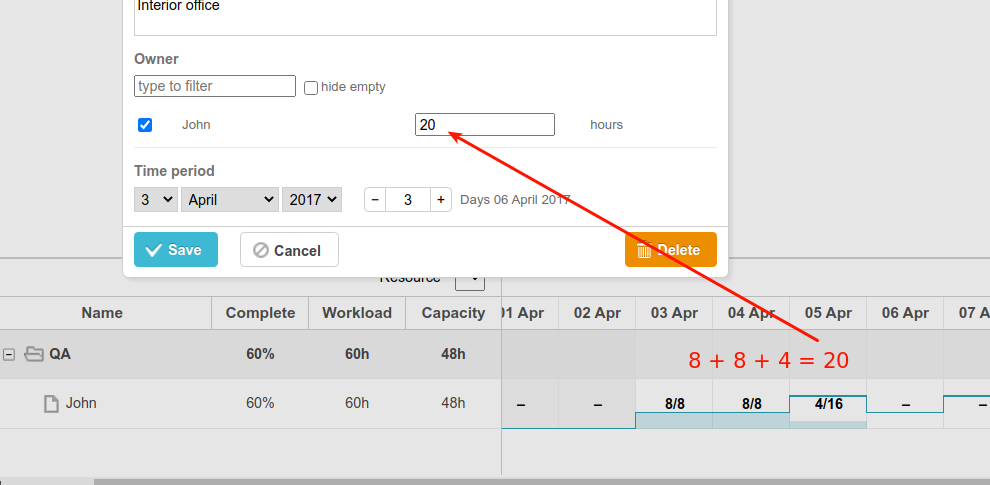
Let us use this snippet to see how it works in practice. In this example, Anna has 13 hours to complete the “Prepare construction documents” task. The task duration is two days. Thus, Anna can devote 6,5 hours per day to this task to complete it in time. You can specify such a formula in the resource_cell_value template and apply it to allocate the workload more efficiently.
Displaying hours and tasks per day
DHTMLX Gantt allows implementing extra functions that facilitate resource loading analysis. This snippet shows how a resource histogram is used to display workload per day in hours or in tasks depending on the switch position. After each Gantt initialization, this switch is provided with an event listener that keeps track of its position. Each switch action changes the resourceMode variable.
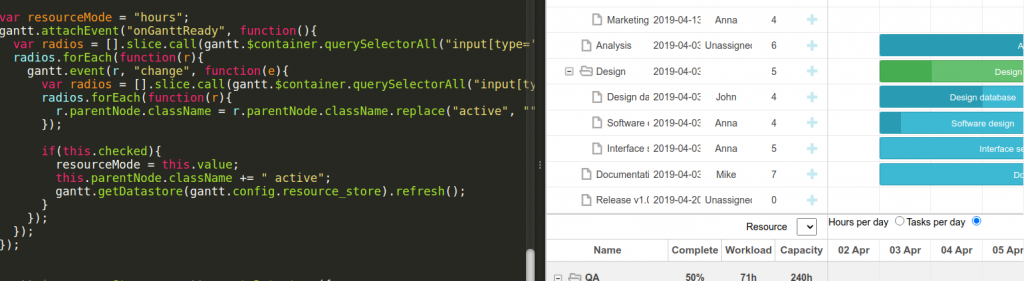
This variable is utilized in several functions, which determine how everything should be calculated. Resource histograms make use of more templates than resource load diagrams: histogram_cell_label, histogram_cell_allocated, histogram_cell_capacity. This is where the values or bars that need to be displayed are calculated.
You can easily implement any kind of logic you need for calculating the resource load in DHTMLX Gantt.
Showing values from the array with dates
Now we proceed with two snippets illustrating how values are displayed from the array with dates. In our official samples, data for a resource histogram is generated from random values. In the snippets, we assign specific values for each day.
In the first example, we assign only one value for each day.
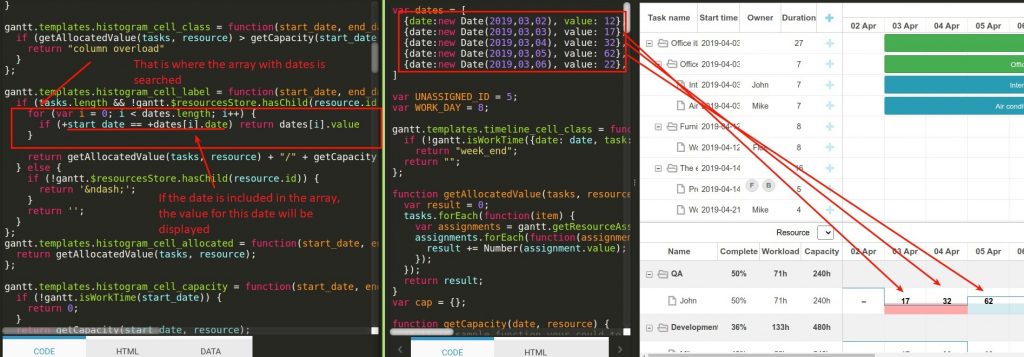
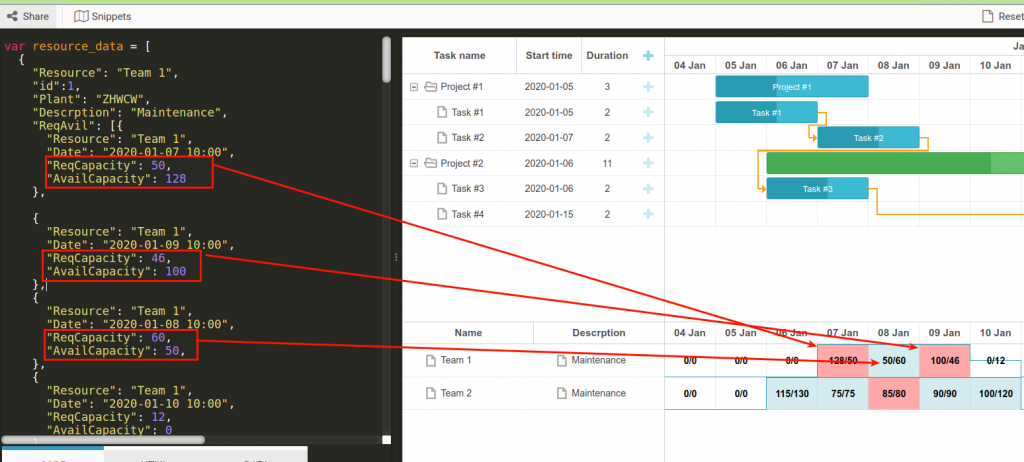
In the second example, we can see the current value and the maximum possible value for each day.
Allocating the capacity in the resource histogram
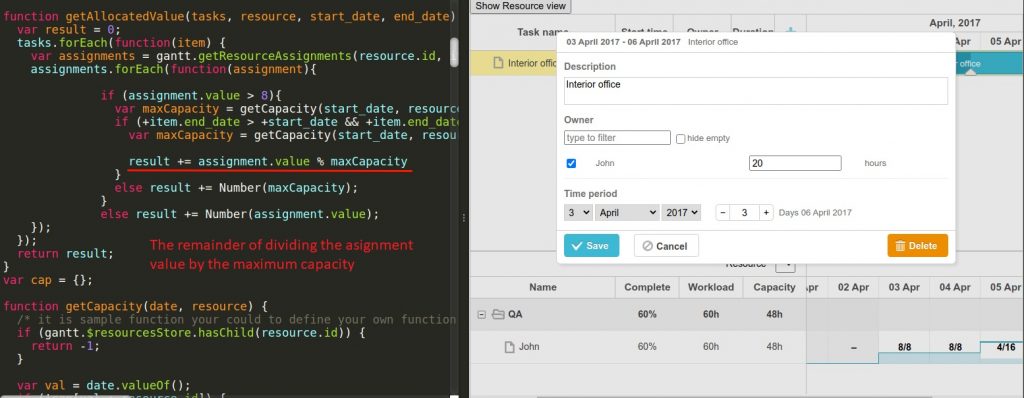
Lastly, we should talk about setting the resource capacity in the resource histogram with DHTMLX Gantt. When considering this example, we can see how the resource capacity is allocated by days:
In fact, the logic is the following: all days except the last one are “filled” to their maximum capacity. Then, the value for the resources left is calculated for the last day. If the assignment value is less than 8, then it will be fully displayed. If it is greater than 8 and this is the last cell, it will show the remainder of the division by 8.
Final words
If you plan to use DHTMLX Gantt in real projects and would like to implement the calculation logic for the resource usage, we’ve got you covered. Our rich collection of samples will help you to create your own custom solution with minimum time and effort.
Related Materials: