The summer release of our powerful component for business intelligence dhtmlxPivot delivers new ways of customizing and tailor-making your JavaScript Pivot table and makes your work with the tool even more convenient. A footer for resulting values of operations, customizing content and formatting data in cells, autowidth for columns, collapsible rows in a tree-like way – here comes version 1.3 new functionality!
Dive deep into the brand-new features and try dhtmlxPivot 30-day evaluation version right now.
Showing Operations’ Total in Footer
Now you can equip your Pivot table with a footer row, where the resulting values of operations from columns will be displayed. For operations with sums the total of all values from the column will be rendered in the corresponding footer cell. For Min and Max operations you’ll find the min and max values from the column there. The footer cell in the column with the Count operation will show you the total count.
The footer row is easily added through the layout configuration with the help of the footer:true option. Read more in documentation >
Custom Content in Cells
The Pivot table is able to render not only values but any type of content in cells depending on your goals of analysis and reporting. You may choose exactly which cells should contain the custom content you need.
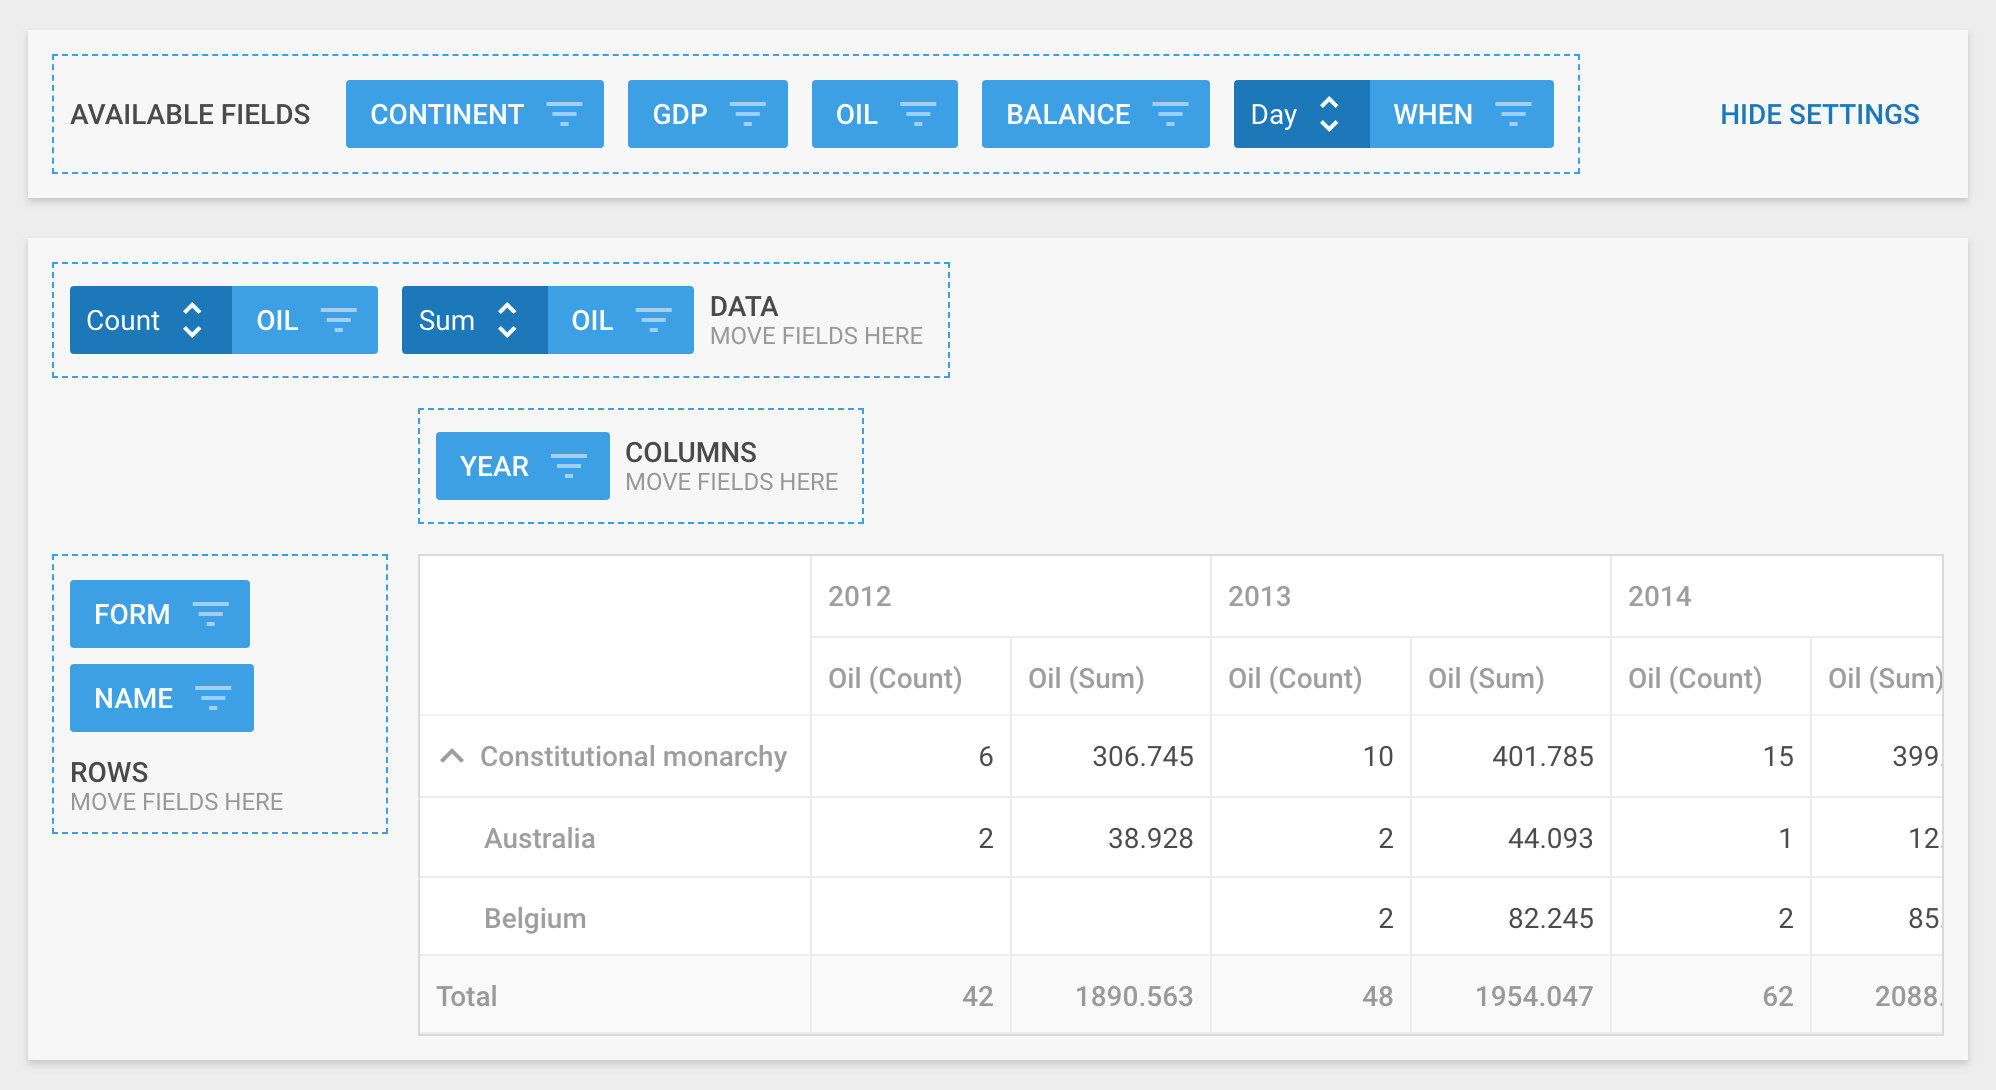
For example, end users need to check, which countries have had more than 3 oil production plants over several years. For this purpose you can define via the cellTemplate property that cells with the value more than 3 in the column with the Count operation for the Oil field will contain checked checkboxes and all other cells – unchecked checkboxes:
data: dataset,
fields: {
rows: ["form", "name"],
columns: ["year"],
values: [{ id: "oil", method: "count" }, { id: "oil", method: "sum" }],
},
fieldList: [
{
id: "oil",
label: "Oil",
cellTemplate: function (text, row, col) {
if (col.method === "sum") {
return '
‘
} else {
return ‘ 3 ? “checked” : “”) + ‘ >
‘
}
}
},
// more fields
]
});
You can modify the content of your Pivot table adding any custom elements in the same way. Check documentation >
Custom Formatting in Cells
The next step of Pivot customization is applying different formats to the values in cells like currency or mathematical symbols, or formatting values by rounding decimals via the customFormat configuration property. You can specify the format of particular cells on the basis of operations in columns. For instance, your Pivot table may show values in the currency format of the country you choose in all columns with summation. The example below illustrates oil production of different countries converted to euro with the German locale applied to the cell values.
Automatic Adjustment of Column Width
If a cell in a column contains some large numbers which don’t fit the cell, the Pivot grid may automatically adjust the column width to the widest cell in this column.
Collapsible Fields in Grid
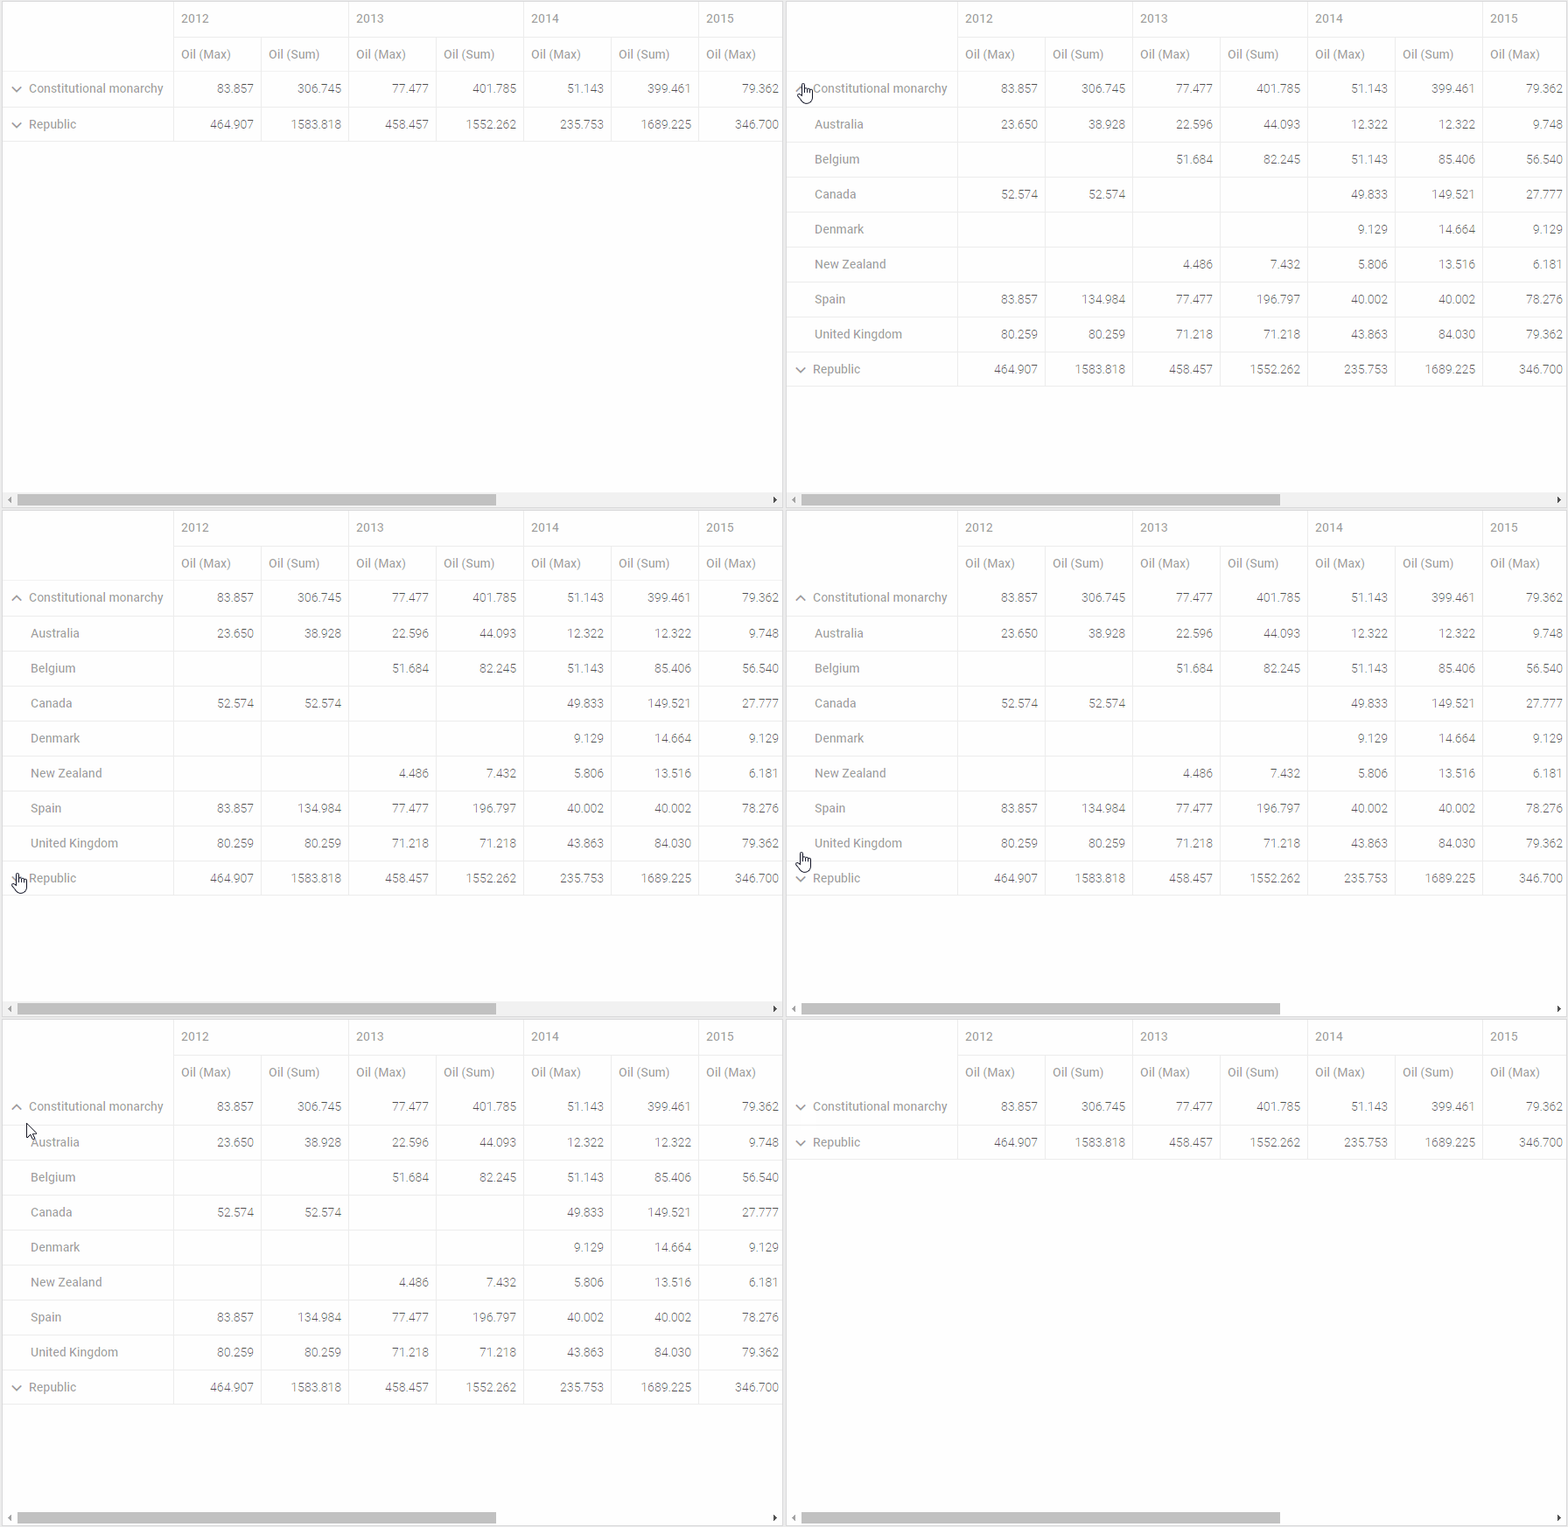
Pivot 1.3 also introduced a more convenient way of presenting data in rows with a possibility to collapse nested rows and expand them in a tree-like structure:

We do hope that dhtmlxPivot new features will come in useful in your projects. Our full documentation will help you take in all the new functionality. You may also check Pivot 1.3 feature list in the “What’s new” section.
We invite our current clients to download the latest version in their Client’s Area.
If you don’t have experience working with our Pivot table, seize a chance to get a free trial version now. Your feedback is highly welcome! Don’t hesitate to leave your comments in the section below or send them to our email.


