Nowadays, the business landscape seems more competitive than ever, and the success of any initiative largely depends on making decisions fast. However, when it is necessary to act quickly, the risk of miscalculations becomes higher. That is where the practice of data-driven decision-making comes into play.
Such an approach to various business matters helps mitigate risks and gain actionable insights. But how do we make it work efficiently when decisions require handling massive amounts of data? It will certainly demand auxiliary instruments that facilitate data analysis.
In this article, we’ll consider the benefits of adopting data-driven decision-making in doing business and how tools like a grid table can enhance the efficiency of this technique.
What is Data-Driven Decision-Making and How it Helps Modern Business
Data-driven decision-making (DDDM) is the practice of gathering and analyzing data to increase the accuracy and effectiveness of decisions, ensuring that they comply with current objectives. Instead of relying on guesswork and assumptions, this approach lays the ground for making decisions backed up with patterns and insights drawn from relevant data.
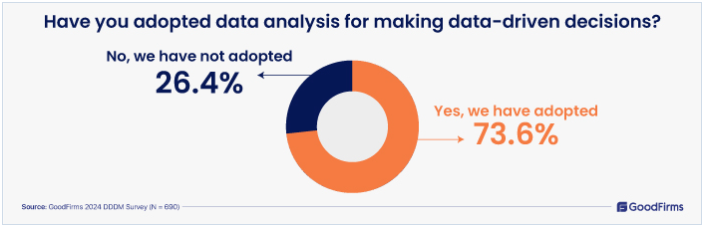
In the recent survey dedicated to DDDM, the GoodFirms company questioned nearly 690 businesses across the globe to learn more about the practical value of this approach. Most of the respondents already apply DDDM for making efficient decisions in real conditions.
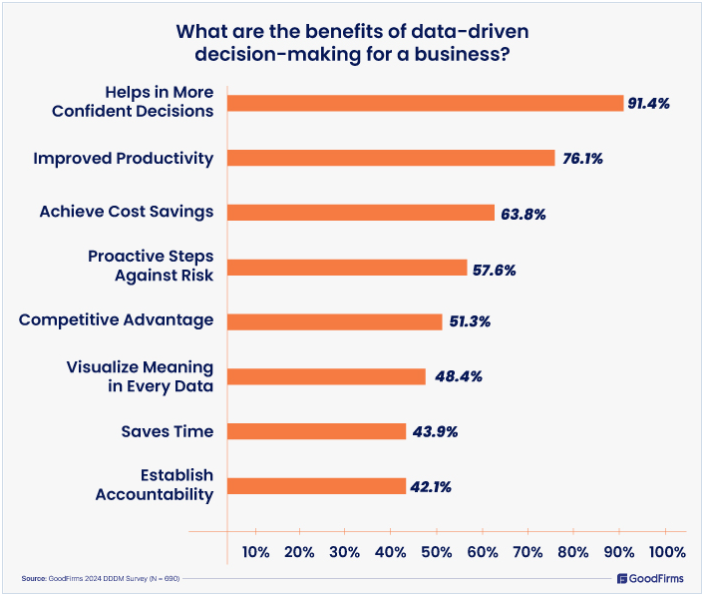
This survey provides a list of other benefits for organizations associated with adopting the DDDM approach, including improved productivity, cost savings, proactive steps against risks, and more.
The use of modern technologies plays a crucial role in the present and future of DDDM. Various tools increase the automation in working with data and give traction to predictive analytics that complements DDDM by providing a forward-looking perspective. According to Allied Market Research, the predictive analytics market is expected to reach USD 35.45 billion by the year 2027, with a CAGR of 21.9%.
While the practical value of DDDM becomes vivid, more organizations will certainly want to try this approach and boost its efficiency with various tools, including DHTMLX libraries.
Increasing DDDM Potential with DHTMLX
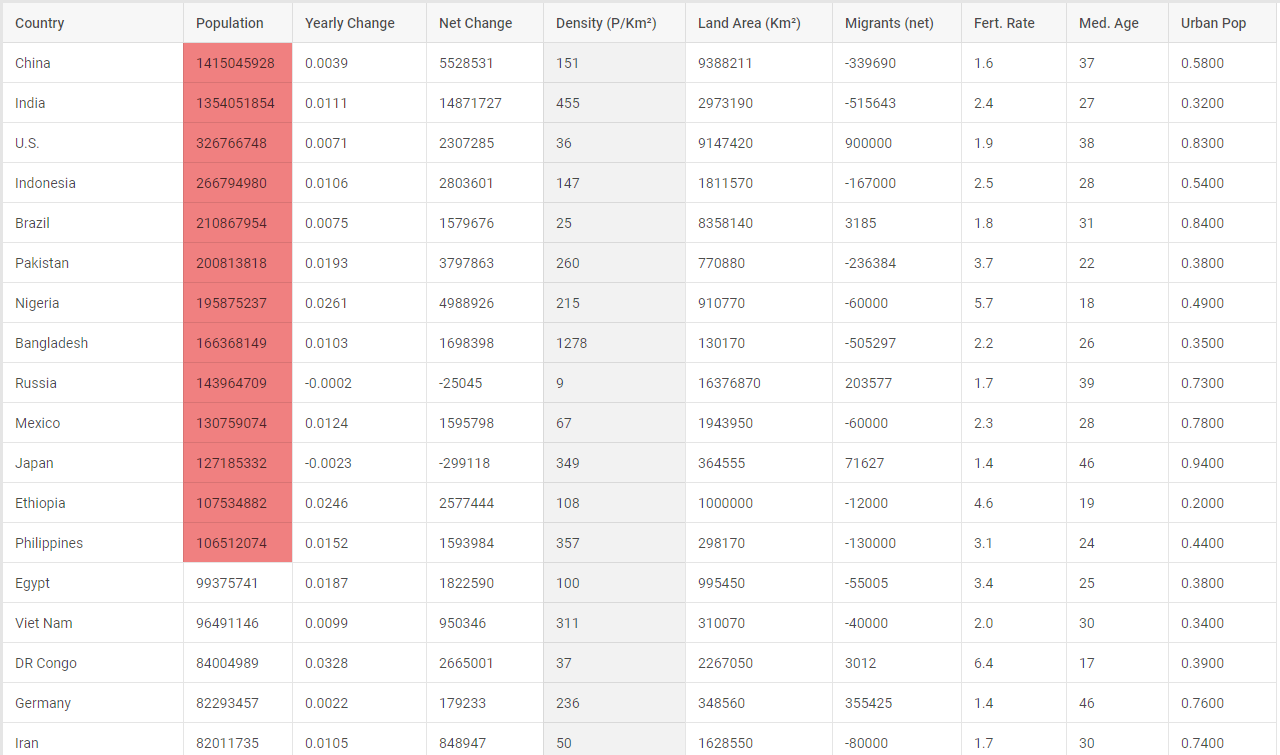
Our product portfolio includes several JavaScript components specifically designed for effective data analysis. The most popular of them is DHTMLX Grid. This JavaScript DataGrid widget offers a powerful feature-set that can be useful in DDDM-oriented web apps. Let us consider some of the main DHTMLX Grid capabilities.
DHTMLX Grid comes with multiple configuration options, providing a high level of flexibility when building a JavaScript data table. For instance, it is possible to hide, freeze, or reorder columns and rows of the table. It is hard to imagine effective data management without sorting and filtering features, and our widget allows implementing and customizing them as needed.
With multiple cell editor types, it becomes easy to specify an appropriate way for editing cells in grid columns depending on their content. As for the content itself, DHTMLX Grid allows adding various types of webpage content to cells, including images, icons, etc. Moreover, the cell content can be enriched with tooltips and marks. No matter what content is used in cells, you can ensure that the information is displayed clearly and neatly thanks to such features as the auto-height mode, auto-width for columns, content alignment, vertical and horizontal spans.
 Check the sample >
The extensive API gives an opportunity to modify the look and behavior of a grid table in accordance with specific requirements. For instance, you are free to specify custom tooltips or cells’ content using templates. Also, there are many options for styling the whole grid table or its particular elements.
 Check the sample >
DHTMLX Grid is notable for high performance (with virtual scrolling and lazy loading onboard) and scalability, therefore it ensures a smooth user experience even with large datasets. It is also worth mentioning some other popular features delivered in this JS widget such as export to PDF and Excel, keyboard navigation, accessibility, and support for touch devices.
Together, these features make DHTMLX Grid a robust tool for building DDDM-oriented apps.
For use-case scenarios that imply the use of Excel formulas, visualizations, and data aggregation, we offer Spreadsheet, Diagram, and Pivot components respectively.
Conclusion
Hasty and ill-founded decisions frequently come very costly, therefore fact-based approaches like DDDM become more relevant than ever. But at the same time, such techniques can be fully effective only with the use of special tools, and DHTMLX helps implement popular functionalities required for making informed decisions. If you consider a tool for implementing a JS grid table and empowering DDDM in a web project, try DHTMLX Grid by downloading a free 30-day trial version of the product.