DHTMLX Scheduler is a comprehensive UI component for handling complex scheduling and task management needs in business-oriented web apps. However, certain scenarios may require custom solutions. For instance, if a project has limited resources i.e. workforce, it is necessary to make sure that their workload is distributed with extra precision. For this purpose, it can be useful to apply a data visualization tool such as a bar chart.
In this tutorial, you will learn how to connect our Scheduler component to the JavaScript Chart library from the DHTMLX Suite, thereby enhancing control over the resource workload in any view of your scheduling app.
Guide on Connecting DHTMLX Scheduler with Suite’s Chart Library
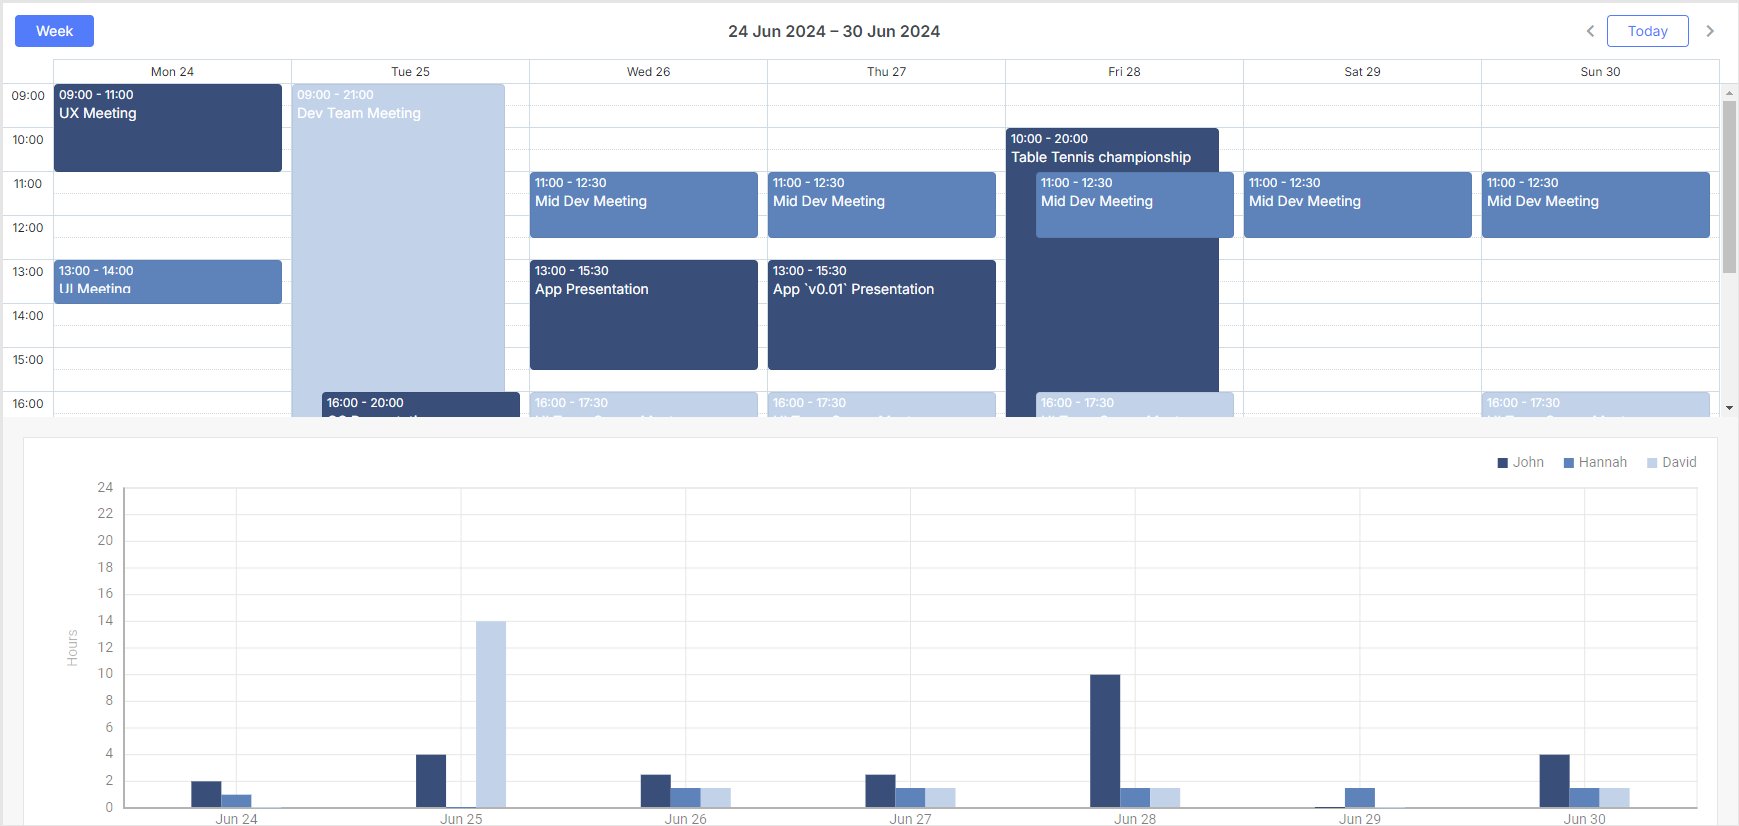
If you need to add an auxiliary mechanism for managing the workload of resources to our JavaScript scheduling library, you can complement it with a bar chart based on the Suite’s Chart widget like in the sample below. Using this sample, you can change the working time of employees, and these changes will be dynamically displayed in the chart. Moreover, you can also hide and show the data on a particular employee in both widgets by simply clicking on names of employees in the chart’s legend.
Previously, we shared with you how to add the Calendar and List controls to DHTMLX Scheduler, so you can be sure that the integration of two DHTMLX products won’t include any hidden pitfalls. But still, we want to highlight the main steps to help you combine DHTMLX Scheduler with the Chart widget much faster.
Step 1: Initializing and Configuring Scheduler
In general, DHTMLX Scheduler can be initialized on a page via the scheduler’s markup or the header configuration property.
In this blog post, we use the second option:
Now, we proceed to the scheduler configuration:
- Limit the displayed work time and set the time step to 30 minutes:
scheduler.config.last_hour = 22;
scheduler.config.time_step = 30;
scheduler.config.cascade_event_display = true;
- Add the ability to assign events to different persons/employees via the lightbox and color them depending on their workplaces. For this purpose, you need to create an array of employees (owner_opts) and add the select control for them to the lightbox:
{ key: 1, label: 'John' },
{ key: 2, label: 'Hannah' },
{ key: 3, label: 'David' }
];
scheduler.locale.labels.section_select = 'Owner';
scheduler.config.lightbox.sections = [
{ name:"text", height:50, map_to:"text", type:"textarea", focus:true },
{ name:"select", height:40, map_to:"owner_id", type:"select", options:owners},
{ name:"time", height:72, type:"time", map_to:"auto"}
];
scheduler.templates.event_class = function(start, end, ev){
return `owner_${ev.owner_id}`;
}
- Set styles for these events in the CSS file:
.owner_1 {
--dhx-scheduler-event-background: #394E79;
--dhx-scheduler-event-color: white;
}
.owner_2 {
--dhx-scheduler-event-background: #5E83BA;
--dhx-scheduler-event-color: white;
}
.owner_3 {
--dhx-scheduler-event-background: #C2D2E9;
--dhx-scheduler-event-color: white;
}
</style>
Next, we move on to DHTMLX Chart.
Step 2: Initializing and Configuring Chart
First, you need to create a config, where you specify the type and other settings for your chart. Use the getConfig function:
return {
type: "bar",
css: "dhx_widget--bg_white dhx_widget--bordered",
// Set the coordinate axes in accordance with the displayed data
scales: {
"bottom": {
text: "day",
textTemplate: function(day) {
return day;
}
},
"left":{
title: "Hours",
max: 24
}
},
// Configure the chart series
series: [
{
id: "A",
value: "John",
fill: "#394E79",
color: "none"
},
{
id: "B",
value: "Hannah",
fill: "#5E83BA",
color: "none"
},
{
id: "C",
value: "David",
fill: "#C2D2E9",
color: "none"
}
],
// Add the chart legend configuration
legend: {
series: ["A", "B", "C"],
form: "rect",
valign: "top",
halign: "right"
}
}
}
After that, you initialize the bar chart using the dhx.Chart object constructor:
Step 3: Transferring Data from Scheduler to Chart
Since Scheduler and Chart use different data formats, you need to convert the scheduler data before transferring it to the chart. To do that, you’ll need to obtain all the events for each day of the week, calculate the duration (in hours) for each of them, and divide these hours between 3 different objects (the number of objects in your scenario can be different, our demo has 3), depending on which owner these events are assigned to.
You’ll need to write custom functions and use part of the Scheduler API:
- Create the calculateEventsLoad() function:
- Get the scheduler view dates via API:
- Declare variables to store the calculated data:
- Calculate the workload for each owner:
- Get events for each day of the week:
- Calculate the workload of events for each owner:
- Push the resulted data into the array that will pass this data to the Chart component:
- Create the function that converts the prepared data to the Chart’s format and parses it to the chart:
let min = state.min_date;
let workload = [];
tempDuration_a = 0;
tempDuration_b = 0;
tempDuration_c = 0;
const duration = (ev.end_date - ev.start_date) / (1000 * 60 * 60);
switch (ev.owner_id) {
case "1":
tempDuration_a += duration;
break;
case "2":
tempDuration_b += duration;
break;
case "3":
tempDuration_c += duration;
break;
}
});
"workload_a": tempDuration_a,
"workload_b": tempDuration_b,
"workload_c": tempDuration_c,
"day": scheduler.date.add(new Date(min), i, "day").getDate()
};
}
generateChartData(workload);
}
// Generate and parse prepared chart's data
const chartData = workload.map(el => ({
day : el.day,
"John" : el.workload_a,
"Hannah" : el.workload_b,
"David" : el.workload_c,
})
);
chart.data.parse(chartData);
}
When calling the calculateEventsLoad() function, you’ll see both the chart and the scheduler with the accurate data.
Step 4: Synchronizing Scheduler with Chart
Lastly, you need to synchronize components to ensure that changes made in the scheduling calendar will be instantly visible in the bar chart. You should use Scheduler event listeners that synchronize scheduler updates into chart like in the example below:
calculateEventsLoad();
});
scheduler.attachEvent("onEventAdded", function(id,ev){
calculateEventsLoad();
});
scheduler.attachEvent("onEventSave",function(id,ev,is_new){
calculateEventsLoad();
return true;
})
scheduler.attachEvent("onViewChange", function (new_mode , new_date){
calculateEventsLoad();
});
Step 5: Synchronizing Filtering Feature in Chart and Scheduler
The bar chart comes with the filtering feature that allows showing and hiding data on a particular employee by clicking on the chart’s legend. You can synchronize this filtering feature with your scheduler to filter events there too.
First, you need to create a variable to store the filter values:
Then, create a helper function to change this variable:
if(filterOptions.has(ownerID)){
filterOptions.delete(ownerID);
}else{
filterOptions.add(ownerID);
}
scheduler.setCurrentView();
}
This helper function will be called after clicking on checkboxes in the chart legend using the toggleSeries event of the Chart component:
switch (id) {
case "A":
setFilter(1);
break;
case "B":
setFilter(2);
break;
case "C":
setFilter(3);
break;
}
});
Now, you should use the resulted array for filtering in your scheduler:
return filterOptions.has(parseInt(event.owner_id));
}
That’s it.
Following the steps above, you can enrich your JavaScript scheduler with a bar chart like in our sample to manage the resource workload more accurately.
Wrapping Up
Proper work with resources is a crucial aspect of effective task management in any project. With JavaScript scheduling calendars, you’ve got to be sure that resources (employees, rooms, equipment) are optimally loaded with tasks or appointments. The use of additional tools such as Suite’s Chart widget gives a more comprehensive perspective on the matter, and this tutorial provides all the necessary info to complete the integration quickly and smoothly.