Today, it has become a must for businesses to work efficiently with big data. Organizations have to deal with huge volumes of data daily to turn them into actionable insights and gain a competitive edge. Traditional tools such as a grid table or spreadsheet cover most of the data analysis needs. However, a pivot table can be a better option in more complex scenarios.
In this article, you will learn when organizations choose pivot tables for working with big data and get acquainted with the DHTMLX tool for implementing this functionality on a web page.
When a Pivot Table Becomes a Necessity
According to Statista, the revenue of the big data market is projected to reach $90 billion and global data creation is expected to grow to more than 180 zettabytes by 2025. These impressive figures prove that organizations will certainly require effective instruments to keep up with the growing flow of information.
Common tools like grids and spreadsheets are extremely popular in software solutions, but at some point, they may fall short. For instance, businesses may need more complex features to make necessary decisions such as multi-metric data analysis, dynamic data aggregation, and real-time reporting. These advanced capabilities can be found in pivot tables. This data analysis tool is designed to provide users with the ability to efficiently explore data from multiple perspectives.
Such functionalities like a pivot table are very popular in enterprise software solutions that make up about 41% of the worldwide software market. Due to the continuing digitalization of the business world, many companies invest in the development of such tools to reach their business goals. Since it is quite a challenging task to implement a pivot table from scratch, developers often use ready-made components like DHTMLX Pivot to simplify the development process. Let’s consider what can be gained from using this JS library in practice.
Benefits of Using DHTMLX Pivot in Solutions for Data Analysis
DHTMLX Pivot is a JavaScript pivot component specifically designed to speed up the creation of feature-rich pivot tables used in more advanced data analysis. In the recent major update to version 2.0, this JS library was fully renewed, became much faster, and received multiple useful features. It offers plenty of benefits for end-users as well as web developers.
Benefits for End-Users
Once DHTMLX Pivot becomes part of an enterprise app, end-users can enjoy multiple features that expand their capabilities in working with complex data.
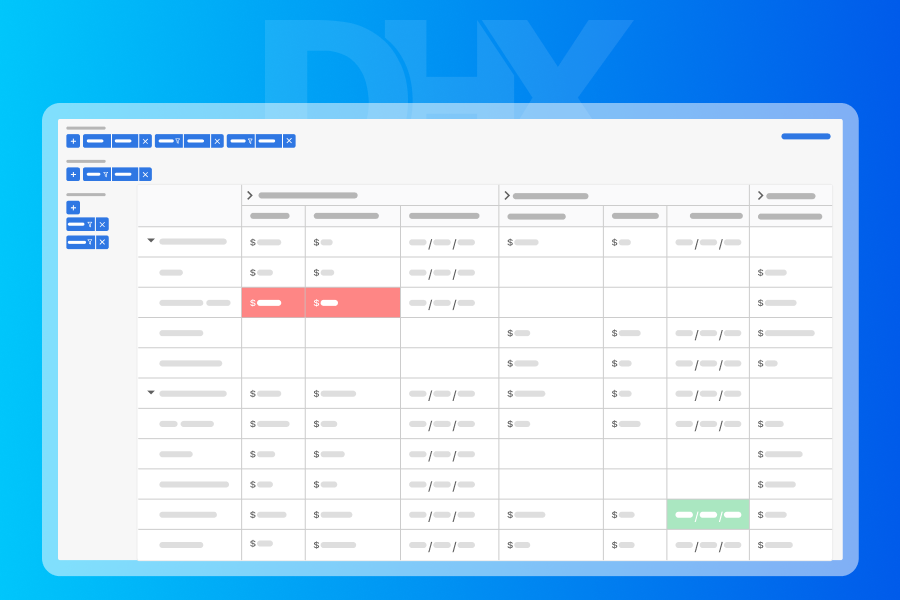
- User-friendly UI
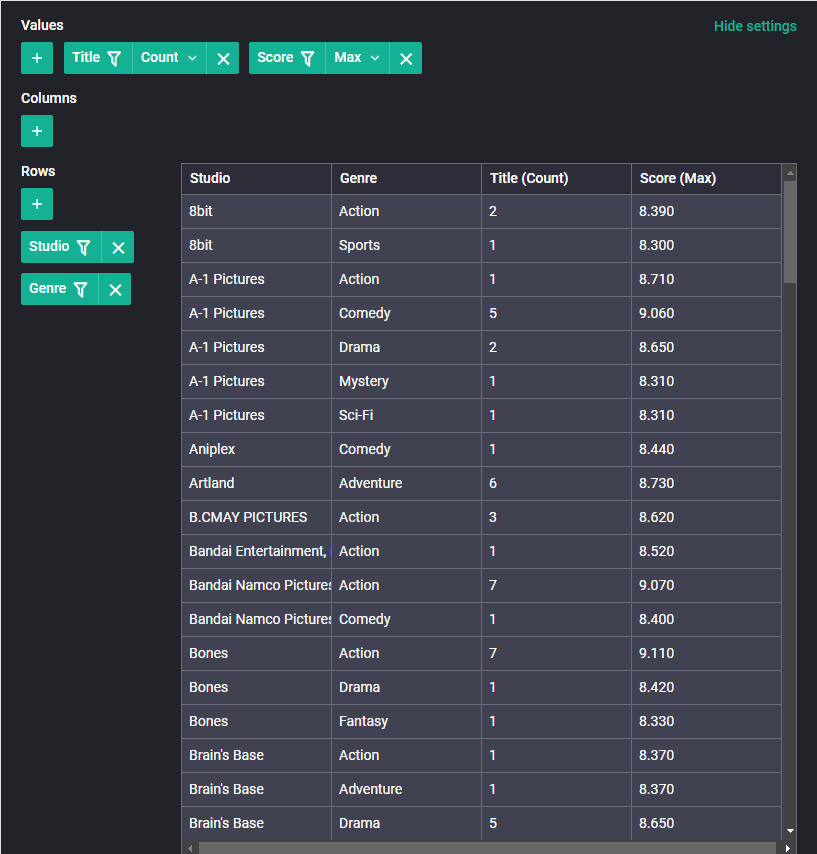
The user interface of our Pivot component includes two main sections: the configuration panel and the table with data. The configuration panel consists of three operation areas (values, rows, and columns), where end-users can perform various operations with data. Those who are new to such an instrument as a pivot table should not worry about potential difficulties, since each aspect of using the table is clearly described in the documentation.
- Math operations and data summaries
DHTMLX Pivot supports many popular math functions by default. They allow end-users to perform basic and more complex calculations for data aggregation. In addition, end-users can draw conclusions from data summaries based on total values.
 Check the sample >
- Custom reporting
Thanks to the high flexibility of the Pivot UI, end-users can rearrange rows, columns, and values i.e. create different data views using the same dataset. There are also useful filtering, grouping, and sorting capabilities. It gives end-users an opportunity to create custom reports that review data from different sides and provide valuable insights.
 Check the sample >
- Real-time recalculations
After introducing any changes in the table’s structure, end-users won’t need to worry about data accuracy since the table’s numeric values will be recalculated in real time.
- Data exporting
When a report (or data analysis results) is ready, end-users may need to save and share the results of their work. For this purpose, DHTMLX Pivot supports export to Excel and CSV with online services. Moreover, we also offer an export module that can be installed on the client’s server. As a result, the exported data will be available for use outside of the app.
All in all, when a pivot table is integrated into a web app, end-users get a comprehensive tool for solving challenging tasks in data analytics.
Benefits for Development Teams
Dev teams can facilitate the development process using the following strengths of DHTMLX Pivot:
- Simple initialization
Web developers won’t need much time to get started with DHTMLX Pivot. The initialization process will take just several simple steps. The detailed documentation contains all the necessary remarks related to the Pivot initialization.
- Extensive API for UI configuration
The API of the Pivot component includes an array of methods, events, and properties for configuring the table elements and the configuration panel as desired. For instance, it is possible to apply filters, freeze certain columns, make rows and columns collapsible, add total values, enable the read-only mode, and much more. Multiple guides and live samples make it much easier for developers to enable various pivot features.
 Check the sample >
- High performance
DHTMLX Pivot is also notable for its powerful performance with large volumes of data. It renders datasets equally well in all popular browsers. Using this sample, you can test how our Pivot performs with datasets of different sizes, from 50,000 up to 1 million rows.
- Flexible styling and customization
DHTMLX Pivot provides an easy way to modify the appearance of the pivot table with custom CSS. In practice, it is often required to highlight particular values (like min and max) in different colors, and CSS variables help easily tackle this task. The built-in Material theme can also be changed with CSS variables. Apart from that, developers can create custom content in cells, and add custom math operations.
 Check the sample >
- Integration with top front-end frameworks
Despite the growing number of front-end frameworks, many web projects are still based on a time-proven trio – React, Angular, and Vue. To simplify developers’ experience in projects built with these frameworks, DHTMLX Pivot comes with integration demos.
- TypeScript support
The use of TypeScript in web projects is constantly growing from year to year. Therefore, it is reasonable that vendors of UI components add TypeScript support for their products and DHTMLX is not an exception. In DHTMLX Pivot, developers can make use of TypeScript definitions, thereby accelerating the development process.
- Free trial version with comprehensive tech support
Web developers can estimate DHTMLX Grid in their scenarios risk-free by downloading a free 30-day trial version of the product. Any challenges during the evaluation period can be quickly resolved with the help of experienced specialists from our support team.
Wrapping Up
Summarizing the above, it is safe to say that a pivot table can be a great addition to any web app with high requirements for data analysis. DHTMLX Pivot is a powerful JS library that brings along multiple advantages for both developers and end-users. With this JS component in their tech stacks, developers can expect an easy integration process, performance optimization, and a wide range of configuration options for delivering responsive and scalable apps. End-users get an intuitive UI with numerous capabilities for dynamic data analysis and custom reporting. Thus, it can be a good solution for businesses requiring pivot table functionality in their enterprise apps.